SeriesCollection getRandomData() { SeriesCollection SC = new SeriesCollection(); Random myR = new Random(); for(int a = 1; a < 2; a++) { Series s = new Series(); for(int b = 1; b < 5; b++) { Element e = new Element(); e.Name = "Element " + b; //e.YValue = -25 + myR.Next(50); e.YValue = myR.Next(50); s.Elements.Add(e); } SC.Add(s); }
// Set full stacked scale for the x axis. Chart.XAxis.Scale = Scale.FullStacked;
// Make the bar fill the whole chart area vertically. Default is 16. Chart.YAxis.SpacingPercentage = 12;
// Place the legend underneath the chart. Chart.LegendBox.Position = LegendBoxPosition.BottomMiddle;
// The following will set axis colors to empty which will make the axis disappear. Chart.XAxis.Clear(); Chart.YAxis.Clear();
// Set the legend box and chart area colors to empty. Chart.LegendBox.ClearColors(); Chart.ChartArea.ClearColors();
// Give the bars some transparency Chart.DefaultSeries.DefaultElement.Transparency = 20;
// Get our data, if you would like to get data from a database you need to use // the data engine. See sample: features/dataEngine.aspx. SeriesCollection sc = getRandomData();
// Transpose the data because currently we have a single series with 4 elements. After the collection // is transposed we end up with 4 series with a single element each. This is necessary because only // series can be stacked on top of each other. sc.Transpose();
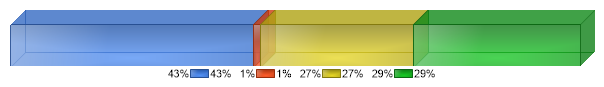
// The bottom legend will only display the name property of legend entries so we set the name template to // percent of total for each series on the chart. Chart.DefaultSeries.LegendEntry.Name = "%PercentOfTotal";
// Add the random data. Chart.SeriesCollection.Add(sc);
Function getRandomData() As SeriesCollection Dim SC As SeriesCollection = New SeriesCollection() Dim myR As Random = New Random() For a As Integer = 1 To 1 Dim s As Series = New Series() For b As Integer = 1 To 4 Dim e As Element = New Element() e.Name = "Element " & b 'e.YValue = -25 + myR.Next(50); e.YValue = myR.Next(50) s.Elements.Add(e) Next b SC.Add(s) Next a
Return SC End Function
Sub Page_Load(ByVal sender As Object, ByVal e As EventArgs)
' Set full stacked scale for the x axis. Chart.XAxis.Scale = Scale.FullStacked
' Make the bar fill the whole chart area vertically. Default is 16. Chart.YAxis.SpacingPercentage = 12
' Place the legend underneath the chart. Chart.LegendBox.Position = LegendBoxPosition.BottomMiddle
' The following will set axis colors to empty which will make the axis disappear. Chart.XAxis.Clear() Chart.YAxis.Clear()
' Set the legend box and chart area colors to empty. Chart.LegendBox.ClearColors() Chart.ChartArea.ClearColors()
' Give the bars some transparency Chart.DefaultSeries.DefaultElement.Transparency = 20
' Get our data, if you would like to get data from a database you need to use ' the data engine. See sample: features/dataEngine.aspx. Dim sc As SeriesCollection = getRandomData()
' Transpose the data because currently we have a single series with 4 elements. After the collection ' is transposed we end up with 4 series with a single element each. This is necessary because only ' series can be stacked on top of each other. sc.Transpose()
' The bottom legend will only display the name property of legend entries so we set the name template to ' percent of total for each series on the chart. Chart.DefaultSeries.LegendEntry.Name = "%PercentOfTotal"
' Add the random data. Chart.SeriesCollection.Add(sc)
End Sub </script> <html xmlns="http://www.w3.org/1999/xhtml"> <head> <title>Mini Stacked Bar</title> </head> <body> <div style="text-align:center"> <dotnet:Chart id="Chart" runat="server"/> </div> </body> </html>