Win Lose Options
Demonstrates several features of the WinLose microChart.
<%@ Page Language="C#" Description="dotnetCHARTING Component" %>
<%@ Register TagPrefix="dotnet" Namespace="dotnetCHARTING" Assembly="dotnetCHARTING" %>
<%@ Import Namespace="System.Drawing" %>
<script runat="server">
void Page_Load(Object sender, EventArgs e)
{
// Demonstrates several features of the WinLose microChart.
Chart.TempDirectory = "temp";
Chart.Background.Color = Color.FromArgb(249,249,255);
Chart.Size = "300x340";
Chart.Debug = true;
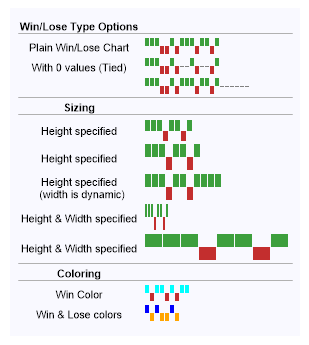
string s = "<block fStyle='Bold'>Win/Lose Type Options<block><hr>";
// A plain Win/Lose chart.
s += "Plain Win/Lose Chart <Chart:WinLose values='1,1,1,-1,-1,1,-1,1,1,1,-1,1,1,-1,1' >";
// Win/Lose with 0 values representing a tie.
s += "<row>With 0 values (Tied) <Chart:WinLose values='1,1,1,-1,-1,1,-1,0,0,1,-1,0,0,-1,1' >";
s += "<row><block><Chart:WinLose values='1,1,1,-1,-1,1,-1,1,1,1,-1,1,1,-1,1,0,0,0,0,0,0' >";
// When a column based microChart width is not specified it is determined automatically.
s += "<hr><block fStyle='Bold'>Sizing<block><hr>";
s += "Height specified <Chart:WinLose values='1,1,1,-1,1,1,-1,1' height='25'>";
// When only the height is specified, the column widths are based on the height and chart width is determined by the column width and number of elements shown.
s += "<row>Height specified <Chart:WinLose values='1,1,1,-1,1,1,-1,1' height='30'>";
s += "<row>Height specified<br> (width is dynamic) <Chart:WinLose values='1,1,1,-1,1,1,-1,1,1,1,1' height='30'>";
s += "<row>Height & Width specified <Chart:WinLose values='1,1,1,-1,1,1,-1,1' height='30' width='30'>";
s += "<row>Height & Width specified <Chart:WinLose values='1,1,1,-1,1,1,-1,1' height='30' width='150'>";
// Specifying colors.
s += "<hr><block fStyle='Bold'>Coloring<block><hr>";
s += "Win Color <Chart:WinLose values='1,-1,1,1,-1,1,-1,1,1' colors='Aqua'>";
s += "<row>Win & Lose colors <Chart:WinLose values='1,-1,1,-1,-1,1,-1' colors='Blue,Orange'>";
Chart.ObjectChart = new dotnetCHARTING.Label(s);
}
</script>
<html xmlns="http://www.w3.org/1999/xhtml">
<head>
<title>.netCHARTING Sample</title>
</head>
<body>
<div align="center">
<dotnet:Chart ID="Chart" runat="server" />
</div>
</body>
</html>
<%@ Page Language="vb" Description="dotnetCHARTING Component" %>
<%@ Register TagPrefix="dotnet" Namespace="dotnetCHARTING" Assembly="dotnetCHARTING" %>
<%@ Import Namespace="System.Drawing" %>
<script runat="server">
Sub Page_Load(ByVal sender As Object, ByVal e As EventArgs)
' Demonstrates several features of the WinLose microChart.
Chart.TempDirectory = "temp"
Chart.Background.Color = Color.FromArgb(249,249,255)
Chart.Size = "300x340"
Chart.Debug = True
Dim s As String = "<block fStyle='Bold'>Win/Lose Type Options<block><hr>"
' A plain Win/Lose chart.
s &= "Plain Win/Lose Chart <Chart:WinLose values='1,1,1,-1,-1,1,-1,1,1,1,-1,1,1,-1,1' >"
' Win/Lose with 0 values representing a tie.
s &= "<row>With 0 values (Tied) <Chart:WinLose values='1,1,1,-1,-1,1,-1,0,0,1,-1,0,0,-1,1' >"
s &= "<row><block><Chart:WinLose values='1,1,1,-1,-1,1,-1,1,1,1,-1,1,1,-1,1,0,0,0,0,0,0' >"
' When a column based microChart width is not specified it is determined automatically.
s &= "<hr><block fStyle='Bold'>Sizing<block><hr>"
s &= "Height specified <Chart:WinLose values='1,1,1,-1,1,1,-1,1' height='25'>"
' When only the height is specified, the column widths are based on the height and chart width is determined by the column width and number of elements shown.
s &= "<row>Height specified <Chart:WinLose values='1,1,1,-1,1,1,-1,1' height='30'>"
s &= "<row>Height specified<br> (width is dynamic) <Chart:WinLose values='1,1,1,-1,1,1,-1,1,1,1,1' height='30'>"
s &= "<row>Height & Width specified <Chart:WinLose values='1,1,1,-1,1,1,-1,1' height='30' width='30'>"
s &= "<row>Height & Width specified <Chart:WinLose values='1,1,1,-1,1,1,-1,1' height='30' width='150'>"
' Specifying colors.
s &= "<hr><block fStyle='Bold'>Coloring<block><hr>"
s &= "Win Color <Chart:WinLose values='1,-1,1,1,-1,1,-1,1,1' colors='Aqua'>"
s &= "<row>Win & Lose colors <Chart:WinLose values='1,-1,1,-1,-1,1,-1' colors='Blue,Orange'>"
Chart.ObjectChart = New dotnetCHARTING.Label(s)
End Sub
</script>
<html xmlns="http://www.w3.org/1999/xhtml">
<head>
<title>.netCHARTING Sample</title>
</head>
<body>
<div align="center">
<dotnet:Chart ID="Chart" runat="server" />
</div>
</body>
</html>