Gallery
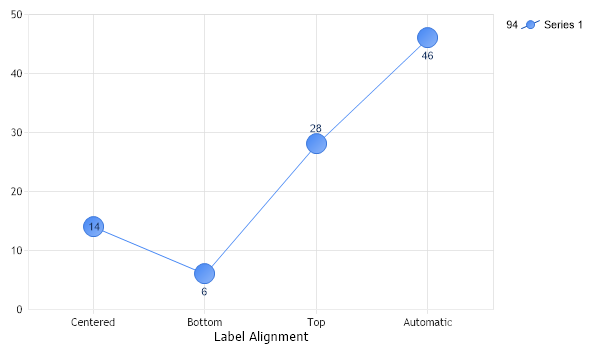
Line Label Alignment
<%@ Page Language="C#" Description="dotnetCHARTING Component" %>
<%@ Register TagPrefix="dotnet" Namespace="dotnetCHARTING" Assembly="dotnetCHARTING"%>
<%@ Import Namespace="System.Drawing" %>
<%@ Import Namespace="System.Drawing.Drawing2D" %>
<html xmlns="http://www.w3.org/1999/xhtml">
<head>
<title>.netCHARTING Sample</title>
<script runat="server">
void Page_Load(Object sender,EventArgs e)
{
Chart.Type = ChartType.Combo;
Chart.Size = "600x350";
Chart.TempDirectory = "temp";
Chart.Debug = true;
//Chart.Title = ".netCHARTING Sample";
Chart.DefaultSeries.Type = SeriesType.Line;
// Demonstrates ....
Chart.DefaultElement.ShowValue = true;
Chart.DefaultElement.Marker.Size = 20;
Chart.XAxis.Label.Text = "Label Alignment";
// *DYNAMIC DATA NOTE*
// This sample uses random data to populate the chart. To populate
// a chart with database data see the following resources:
// - Classic samples folder
// - Help File > Data Tutorials
// - Sample: features/DataEngine.aspx
SeriesCollection mySC = getRandomData();
mySC[0][0].SmartLabel.Alignment = LabelAlignment.Center;
mySC[0][1].SmartLabel.Alignment = LabelAlignment.Bottom;
mySC[0][2].SmartLabel.Alignment = LabelAlignment.Top;
mySC[0][3].SmartLabel.Alignment = LabelAlignment.Automatic;
mySC[0][0].Name = "Centered";
mySC[0][1].Name = "Bottom";
mySC[0][2].Name = "Top";
mySC[0][3].Name = "Automatic";
// Add the random data.
Chart.SeriesCollection.Add(mySC);
}
SeriesCollection getRandomData()
{
SeriesCollection SC = new SeriesCollection();
Random myR = new Random(1);
for(int a = 1; a < 2; a++)
{
Series s = new Series();
s.Name = "Series " + a.ToString();
for(int b = 1; b < 5; b++)
{
Element e = new Element();
e.Name = "Element " + b.ToString();
e.YValue = myR.Next(60);
s.Elements.Add(e);
}
SC.Add(s);
}
return SC;
}
</script>
</head>
<body>
<div style="text-align:center">
<dotnet:Chart id="Chart" runat="server" Width="568px" Height="344px">
</dotnet:Chart>
</div>
</body>
</html>
<%@ Page Language="vb" Description="dotnetCHARTING Component" %>
<%@ Register TagPrefix="dotnet" Namespace="dotnetCHARTING" Assembly="dotnetCHARTING"%>
<%@ Import Namespace="System.Drawing" %>
<%@ Import Namespace="System.Drawing.Drawing2D" %>
<html xmlns="http://www.w3.org/1999/xhtml">
<head>
<title>.netCHARTING Sample</title>
<script runat="server">
Sub Page_Load(ByVal sender As Object, ByVal e As EventArgs)
Chart.Type = ChartType.Combo
Chart.Size = "600x350"
Chart.TempDirectory = "temp"
Chart.Debug = True
'Chart.Title = ".netCHARTING Sample";
Chart.DefaultSeries.Type = SeriesType.Line
' Demonstrates ....
Chart.DefaultElement.ShowValue = True
Chart.DefaultElement.Marker.Size = 20
Chart.XAxis.Label.Text = "Label Alignment"
' *DYNAMIC DATA NOTE*
' This sample uses random data to populate the chart. To populate
' a chart with database data see the following resources:
' - Classic samples folder
' - Help File > Data Tutorials
' - Sample: features/DataEngine.aspx
Dim mySC As SeriesCollection = getRandomData()
mySC(0)(0).SmartLabel.Alignment = LabelAlignment.Center
mySC(0)(1).SmartLabel.Alignment = LabelAlignment.Bottom
mySC(0)(2).SmartLabel.Alignment = LabelAlignment.Top
mySC(0)(3).SmartLabel.Alignment = LabelAlignment.Automatic
mySC(0)(0).Name = "Centered"
mySC(0)(1).Name = "Bottom"
mySC(0)(2).Name = "Top"
mySC(0)(3).Name = "Automatic"
' Add the random data.
Chart.SeriesCollection.Add(mySC)
End Sub
Function getRandomData() As SeriesCollection
Dim SC As SeriesCollection = New SeriesCollection()
Dim myR As Random = New Random(1)
For a As Integer = 1 To 1
Dim s As Series = New Series()
s.Name = "Series " & a.ToString()
For b As Integer = 1 To 4
Dim e As Element = New Element()
e.Name = "Element " & b.ToString()
e.YValue = myR.Next(60)
s.Elements.Add(e)
Next b
SC.Add(s)
Next a
Return SC
End Function
</script>
</head>
<body>
<div style="text-align:center">
<dotnet:Chart id="Chart" runat="server" Width="568px" Height="344px">
</dotnet:Chart>
</div>
</body>
</html>
- Sample FilenameLineLabelAlignment.aspx
- VersionLegacy (Pre 3.0)
- Uses DatabaseNo