Gallery
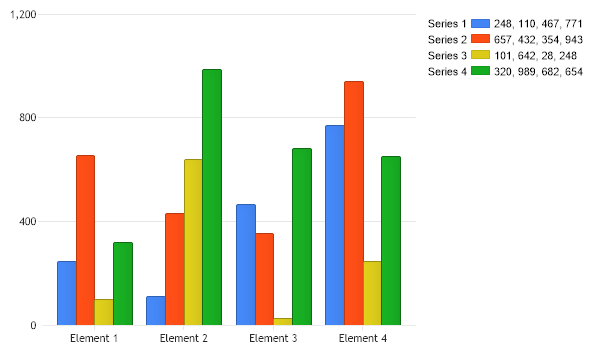
Legend With Data For Series
<%@ Import Namespace="System.Drawing" %>
<%@ Register TagPrefix="dotnet" Namespace="dotnetCHARTING" Assembly="dotnetCHARTING" %>
<%@ Page Language="C#" Description="dotnetCHARTING Component" %>
<html>
<head>
<title>Gallery Sample (Time Gantt Chart in 2D)</title>
<script runat="server">
// Demonstrates how element values can be inserted into the legend box beside the series.
Color [] palette = ChartPalettes.GetPalette(Palette.Default);
void Page_Load(Object sender, EventArgs e)
{
Chart.Type = ChartType.Combo;//Horizontal;
Chart.Width = 600;
Chart.Height = 350;
Chart.TempDirectory = "temp";
Chart.Debug = true;
Chart.DefaultSeries.LegendEntry.Visible = false;
SeriesCollection sc = getRandomData(1);
// Add the random data.
Chart.SeriesCollection.Add(sc);
for (int i = 0; i < sc.Count; i++)
Chart.LegendBox.ExtraEntries.Add(getEntry(sc[i], i));
Chart.LegendBox.Template = "%Name%Icon%Value";
}
/// <summary>
/// This method processes a populated series legend entry and inserts the element values into the LegendEntry 'Value' property.
/// </summary>
LegendEntry getEntry(Series s, int index)
{
LegendEntry le = new LegendEntry();
le.Name = s.Name;
le.Value = "";
le.SeriesType = SeriesType.Column;
le.Background.Color = palette[index];
for (int i = 0; i < s.Elements.Count; i++)
{
Element el = s.Elements[i];
le.Value += el.YValue.ToString();
if (i < s.Elements.Count - 1) le.Value += ", ";
}
return le;
}
SeriesCollection getRandomData(int seed)
{
SeriesCollection SC = new SeriesCollection();
Random myR = new Random(seed);
for (int a = 1; a < 5; a++)
{
Series s = new Series();
s.Name = "Series " + a;
for (int b = 1; b < 5; b++)
{
Element e = new Element();
e.Name = "Element " + b;
e.YValue = myR.Next(1000);
s.Elements.Add(e);
}
SC.Add(s);
}
return SC;
}
SeriesCollection getLiveData()
{
DataEngine de = new DataEngine("ConnectionString goes here");
de.ChartObject = Chart; // Necessary to view any errors the dataEngine may throw.
de.SqlStatement = "SELECT XAxisColumn, YAxisColumn FROM ....";
return de.GetSeries();
}
</script>
</head>
<body>
<div align="center">
<dotnet:Chart ID="Chart" runat="server" />
</div>
</body>
</html>
<%@ Import Namespace="System.Drawing" %>
<%@ Register TagPrefix="dotnet" Namespace="dotnetCHARTING" Assembly="dotnetCHARTING" %>
<%@ Page Language="vb" Description="dotnetCHARTING Component" %>
<html>
<head>
<title>Gallery Sample (Time Gantt Chart in 2D)</title>
<script runat="server">
' Demonstrates how element values can be inserted into the legend box beside the series.
Dim palette As Color() = ChartPalettes.GetPalette(dotnetCHARTING.Palette.Default)
Sub Page_Load(ByVal sender As Object, ByVal e As EventArgs)
Chart.Type = ChartType.Combo 'Horizontal;
Chart.Width = 600
Chart.Height = 350
Chart.TempDirectory = "temp"
Chart.Debug = True
Chart.DefaultSeries.LegendEntry.Visible = False
Dim sc As SeriesCollection = getRandomData(1)
' Add the random data.
Chart.SeriesCollection.Add(sc)
For i As Integer = 0 To sc.Count - 1
Chart.LegendBox.ExtraEntries.Add(getEntry(sc(i), i))
Next i
Chart.LegendBox.Template = "%Name%Icon%Value"
End Sub
''' <summary>
''' This method processes a populated series legend entry and inserts the element values into the LegendEntry 'Value' property.
''' </summary>
Function getEntry(ByVal s As Series, ByVal index As Integer) As LegendEntry
Dim le As LegendEntry = New LegendEntry()
le.Name = s.Name
le.Value = ""
le.SeriesType = SeriesType.Column
le.Background.Color = palette(index)
For i As Integer = 0 To s.Elements.Count - 1
Dim el As Element = s.Elements(i)
le.Value += el.YValue.ToString()
If i < s.Elements.Count - 1 Then
le.Value &= ", "
End If
Next i
Return le
End Function
Function getRandomData(ByVal seed As Integer) As SeriesCollection
Dim SC As SeriesCollection = New SeriesCollection()
Dim myR As Random = New Random(seed)
For a As Integer = 1 To 4
Dim s As Series = New Series()
s.Name = "Series " & a
For b As Integer = 1 To 4
Dim e As Element = New Element()
e.Name = "Element " & b
e.YValue = myR.Next(1000)
s.Elements.Add(e)
Next b
SC.Add(s)
Next a
Return SC
End Function
Function getLiveData() As SeriesCollection
Dim de As DataEngine = New DataEngine("ConnectionString goes here")
de.ChartObject = Chart ' Necessary to view any errors the dataEngine may throw.
de.SqlStatement = "SELECT XAxisColumn, YAxisColumn FROM ...."
Return de.GetSeries()
End Function
</script>
</head>
<body>
<div align="center">
<dotnet:Chart ID="Chart" runat="server" />
</div>
</body>
</html>
- Sample FilenameLegendWithDataForSeries.aspx
- Version5.0
- Uses DatabaseNo