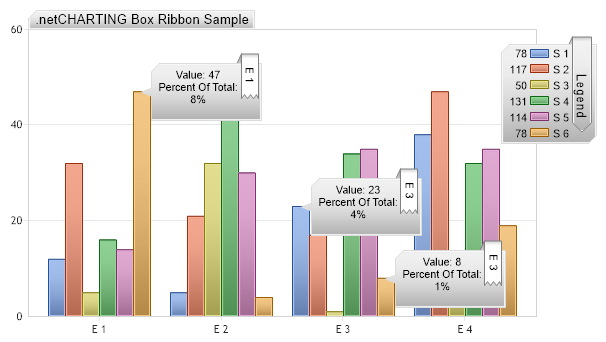
// Define an annotation style to use with element annotations. Annotation an = new Annotation(); an.Header.Label.Text = "%Name"; an.Header.Orientation = dotnetCHARTING.Orientation.Right; an.Header.StartCap = BoxCapStyle.RibbonDown; an.Header.EndAlignment = EdgeAlignment.Inside; an.Header.Label.Alignment = StringAlignment.Near; an.Header.EndCap = BoxCapStyle.Torn; an.Header.Offset = new Point(0, 3); an.Orientation = dotnetCHARTING.Orientation.Right; an.Background.ShadingEffectMode = ShadingEffectMode.Seven;
// *DYNAMIC DATA NOTE* // This sample uses random data to populate the chart. To populate // a chart with database data see the following resources: // - Use the getLiveData() method using the dataEngine to query a database. // - Help File > Getting Started > Data Tutorials // - DataEngine Class in the help file // - Sample: features/DataEngine.aspx
SeriesCollection mySC = getRandomData();
// Add annotations to a select few elements using the above predefined style. mySC[5][0].Annotation = new Annotation("Value: %YValue <br>Percent Of Total: %PercentOfTotal", an); mySC[5][2].Annotation = new Annotation("Value: %YValue <br>Percent Of Total: %PercentOfTotal", an); mySC[0][2].Annotation = new Annotation("Value: %YValue <br>Percent Of Total: %PercentOfTotal", an);
// Add the random data. Chart.SeriesCollection.Add(mySC); }
SeriesCollection getRandomData() { Random myR = new Random(1); SeriesCollection SC = new SeriesCollection(); for (int a = 1; a < 7; a++) { Series s = new Series("S " + a.ToString()); for (int b = 1; b < 5; b++) { Element e = new Element("E " + b.ToString()); e.YValue = myR.Next(50); s.Elements.Add(e); } SC.Add(s); } return SC; }
SeriesCollection getLiveData() { DataEngine de = new DataEngine(ConfigurationManager.AppSettings["DNCConnectionString"]); de.ChartObject = Chart; // Necessary to view any errors the dataEngine may throw. de.SqlStatement = "SELECT XAxisColumn, YAxisColumn FROM ...."; return de.GetSeries(); }
' Define an annotation style to use with element annotations. Dim an As Annotation = New Annotation() an.Header.Label.Text = "%Name" an.Header.Orientation = dotnetCHARTING.Orientation.Right an.Header.StartCap = BoxCapStyle.RibbonDown an.Header.EndAlignment = EdgeAlignment.Inside an.Header.Label.Alignment = StringAlignment.Near an.Header.EndCap = BoxCapStyle.Torn an.Header.Offset = New Point(0, 3) an.Orientation = dotnetCHARTING.Orientation.Right an.Background.ShadingEffectMode = ShadingEffectMode.Seven
' *DYNAMIC DATA NOTE* ' This sample uses random data to populate the chart. To populate ' a chart with database data see the following resources: ' - Use the getLiveData() method using the dataEngine to query a database. ' - Help File > Getting Started > Data Tutorials ' - DataEngine Class in the help file ' - Sample: features/DataEngine.aspx
Dim mySC As SeriesCollection = getRandomData()
' Add annotations to a select few elements using the above predefined style. mySC(5)(0).Annotation = New Annotation("Value: %YValue <br>Percent Of Total: %PercentOfTotal", an) mySC(5)(2).Annotation = New Annotation("Value: %YValue <br>Percent Of Total: %PercentOfTotal", an) mySC(0)(2).Annotation = New Annotation("Value: %YValue <br>Percent Of Total: %PercentOfTotal", an)
' Add the random data. Chart.SeriesCollection.Add(mySC) End Sub
Function getRandomData() As SeriesCollection Dim myR As Random = New Random(1) Dim SC As SeriesCollection = New SeriesCollection() For a As Integer = 1 To 6 Dim s As Series = New Series("S " & a.ToString()) For b As Integer = 1 To 4 Dim e As Element = New Element("E " & b.ToString()) e.YValue = myR.Next(50) s.Elements.Add(e) Next b SC.Add(s) Next a Return SC End Function
Function getLiveData() As SeriesCollection Dim de As DataEngine = New DataEngine(ConfigurationManager.AppSettings("DNCConnectionString")) de.ChartObject = Chart ' Necessary to view any errors the dataEngine may throw. de.SqlStatement = "SELECT XAxisColumn, YAxisColumn FROM ...." Return de.GetSeries() End Function