Gallery
Legend Box Multiple
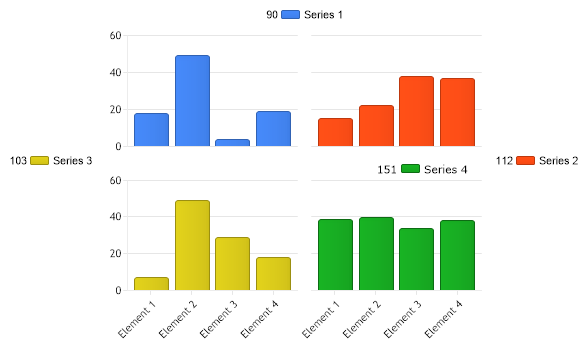
How multiple chart areas can have their data placed in separate legend boxes.
- Sample FilenameLegendBoxMultiple.aspx
- VersionLegacy (Pre 3.0)
- Uses DatabaseNo