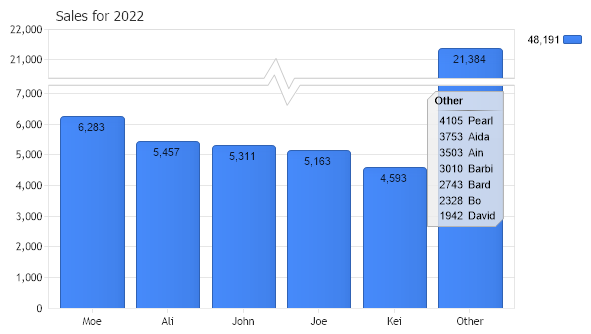
Legend Box Element 2
Use the legend box to describe the 'other' element.
<%@ Page Language="C#" Description="dotnetCHARTING Component" %>
<%@ Register TagPrefix="dotnet" Namespace="dotnetCHARTING" Assembly="dotnetCHARTING"%>
<%@ Import Namespace="System.Drawing" %>
<html xmlns="http://www.w3.org/1999/xhtml">
<head>
<title>.netCHARTING Sample</title>
<script runat="server">
void Page_Load(Object sender,EventArgs e)
{
Chart.Type = ChartType.Combo;//Horizontal;
Chart.Width = 600;
Chart.Height = 350;
Chart.TempDirectory = "temp";
Chart.Debug = true;
Chart.Title = "Sales for 2022";
Chart.DefaultSeries.DefaultElement.ShowValue = true;
// Demonstrates how to use the legend box to describe the 'other' element of a
// limited series.
// Setup the data engine
DataEngine de = new DataEngine(ConfigurationManager.AppSettings["DNCConnectionString"]);
de.StartDate=new System.DateTime(2022,1,1,0,0,0);
de.EndDate = new System.DateTime(2022,12,31,23,59,59);
de.SqlStatement= @"SELECT Name,Sum(Quantity) FROM Orders WHERE OrderDate >= #STARTDATE# AND OrderDate <= #ENDDATE# GROUP BY Orders.Name ORDER BY Sum(Quantity) DESC";
// Limit to 5 elements
de.Limit = "5";
// Add the series the the chart
Chart.SeriesCollection.Add(de.GetSeries());
// Update the dataEngine to get only the excluded part.
de.LimitMode = LimitMode.ExcludeTop;
de.ShowOther = false;
// Get the new series.
SeriesCollection mySC2 = de.GetSeries();
// Create a legend box to hold the new series
LegendBox lb = new LegendBox();
lb.Template = "%Value %Name";
lb.HeaderEntry.Visible = true;
lb.HeaderEntry.Value = "Other";
lb.Position = new Point(427,105);
lb.HeaderEntry.Name = "";
lb.Line.Color=Color.FromArgb(180, 180, 180);
lb.Background.Color = Color.FromArgb(200, 236, 236, 236);
// Specify the data source.
lb.DataSource = DataSource.FromSeriesCollection(mySC2,DataSourceType.Element);
// Add the new legend to the chart.
Chart.ExtraLegendBoxes.Add(lb);
// So the column differences are more apparent, smart scale break will be activated.
Chart.YAxis.SmartScaleBreak = true;
}
</script>
</head>
<body>
<div style="text-align:center">
<dotnet:Chart id="Chart" runat="server" Width="568px" Height="344px">
</dotnet:Chart>
</div>
</body>
</html>
<%@ Page Language="vb" Description="dotnetCHARTING Component" %>
<%@ Register TagPrefix="dotnet" Namespace="dotnetCHARTING" Assembly="dotnetCHARTING"%>
<%@ Import Namespace="System.Drawing" %>
<html xmlns="http://www.w3.org/1999/xhtml">
<head>
<title>.netCHARTING Sample</title>
<script runat="server">
Sub Page_Load(ByVal sender As Object, ByVal e As EventArgs)
Chart.Type = ChartType.Combo 'Horizontal;
Chart.Width = 600
Chart.Height = 350
Chart.TempDirectory = "temp"
Chart.Debug = True
Chart.Title = "Sales for 2022"
Chart.DefaultSeries.DefaultElement.ShowValue = True
' Demonstrates how to use the legend box to describe the 'other' element of a
' limited series.
' Setup the data engine
Dim de As DataEngine = New DataEngine(ConfigurationManager.AppSettings("DNCConnectionString"))
de.StartDate = New System.DateTime(2022,1,1,0,0,0)
de.EndDate = New System.DateTime(2022,12,31,23,59,59)
de.SqlStatement= "SELECT Name,Sum(Quantity) FROM Orders WHERE OrderDate >= #STARTDATE# AND OrderDate <= #ENDDATE# GROUP BY Orders.Name ORDER BY Sum(Quantity) DESC"
' Limit to 5 elements
de.Limit = "5"
' Add the series the the chart
Chart.SeriesCollection.Add(de.GetSeries())
' Update the dataEngine to get only the excluded part.
de.LimitMode = LimitMode.ExcludeTop
de.ShowOther = False
' Get the new series.
Dim mySC2 As SeriesCollection = de.GetSeries()
' Create a legend box to hold the new series
Dim lb As LegendBox = New LegendBox()
lb.Template = "%Value %Name"
lb.HeaderEntry.Visible = True
lb.HeaderEntry.Value = "Other"
lb.Position = New Point(427,105)
lb.HeaderEntry.Name = ""
lb.Line.Color=Color.FromArgb(180, 180, 180)
lb.Background.Color = Color.FromArgb(200, 236, 236, 236)
' Specify the data source.
lb.DataSource = DataSource.FromSeriesCollection(mySC2,DataSourceType.Element)
' Add the new legend to the chart.
Chart.ExtraLegendBoxes.Add(lb)
' So the column differences are more apparent, smart scale break will be activated.
Chart.YAxis.SmartScaleBreak = True
End Sub
</script>
</head>
<body>
<div style="text-align:center">
<dotnet:Chart id="Chart" runat="server" Width="568px" Height="344px">
</dotnet:Chart>
</div>
</body>
</html>