Gallery
Invisible Legend Entry
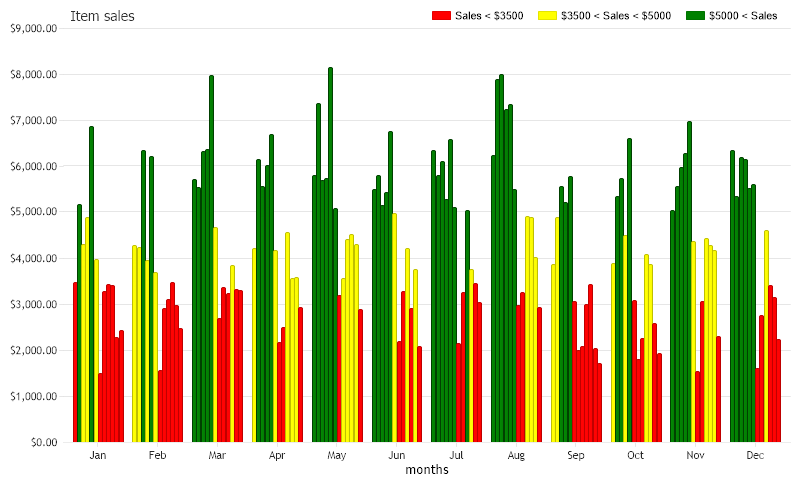
Demonstrates making the original legend entries invisible and adding 3 custom legend entries.
- Sample FilenameInvisibleLegendEntry.aspx
- VersionLegacy (Pre 3.0)
- Uses DatabaseYes