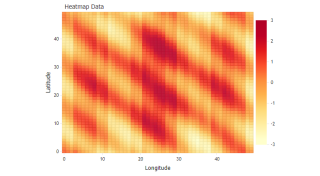
- JS Live Heatmap
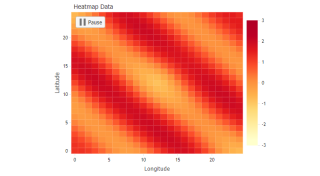
Demonstrates a heatmap chart with smartPalette.
- JS Multivariate Tile Map
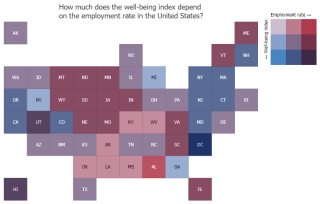
Demonstrates a multivariate tile map chart of US states.
- JS Status Map Timeline
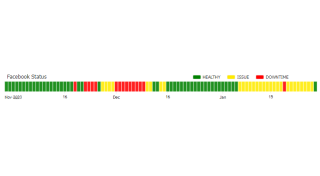
Demonstrates a status map timeline chart.
- JS Tile Map
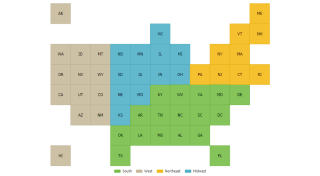
Demonstrates a simple tile map chart of US states.
- JS Tile Map Microcharts
A tile map chart with microcharts.
- JS Rankings Matrix Diagram
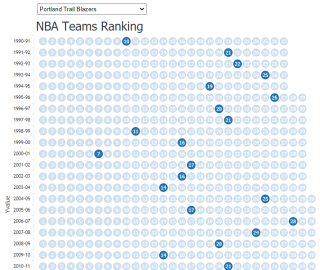
Demonstrates interactive matrix diagram chart of NBA team ranking using series selection.
- JS Waffle Chart
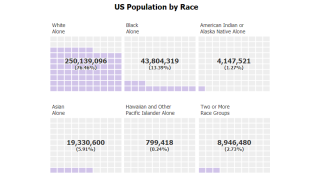
Demonstrates Waffle chart created using multiple heatmap charts.
- JS Circular Heatmap
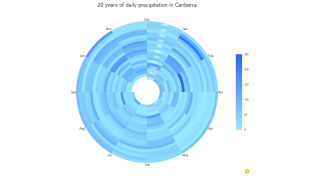
This sample deomonstrates a circular heatmap chart using gauge with columns.
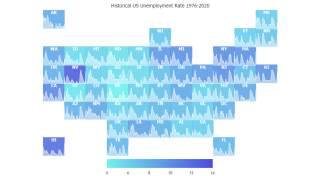
- JS Barcode Chart
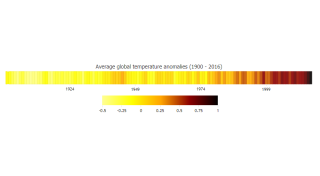
Demonstrates a linear heatmap showing temperature anomalies over time.
- JS Heatmap Dense
Demonstrates a heatmap chart with smartPalette legend entries.
- JS Heatmap Algorithm
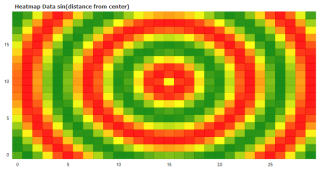
Demonstrates using a smartPalette with a heatmap chart.