Gallery
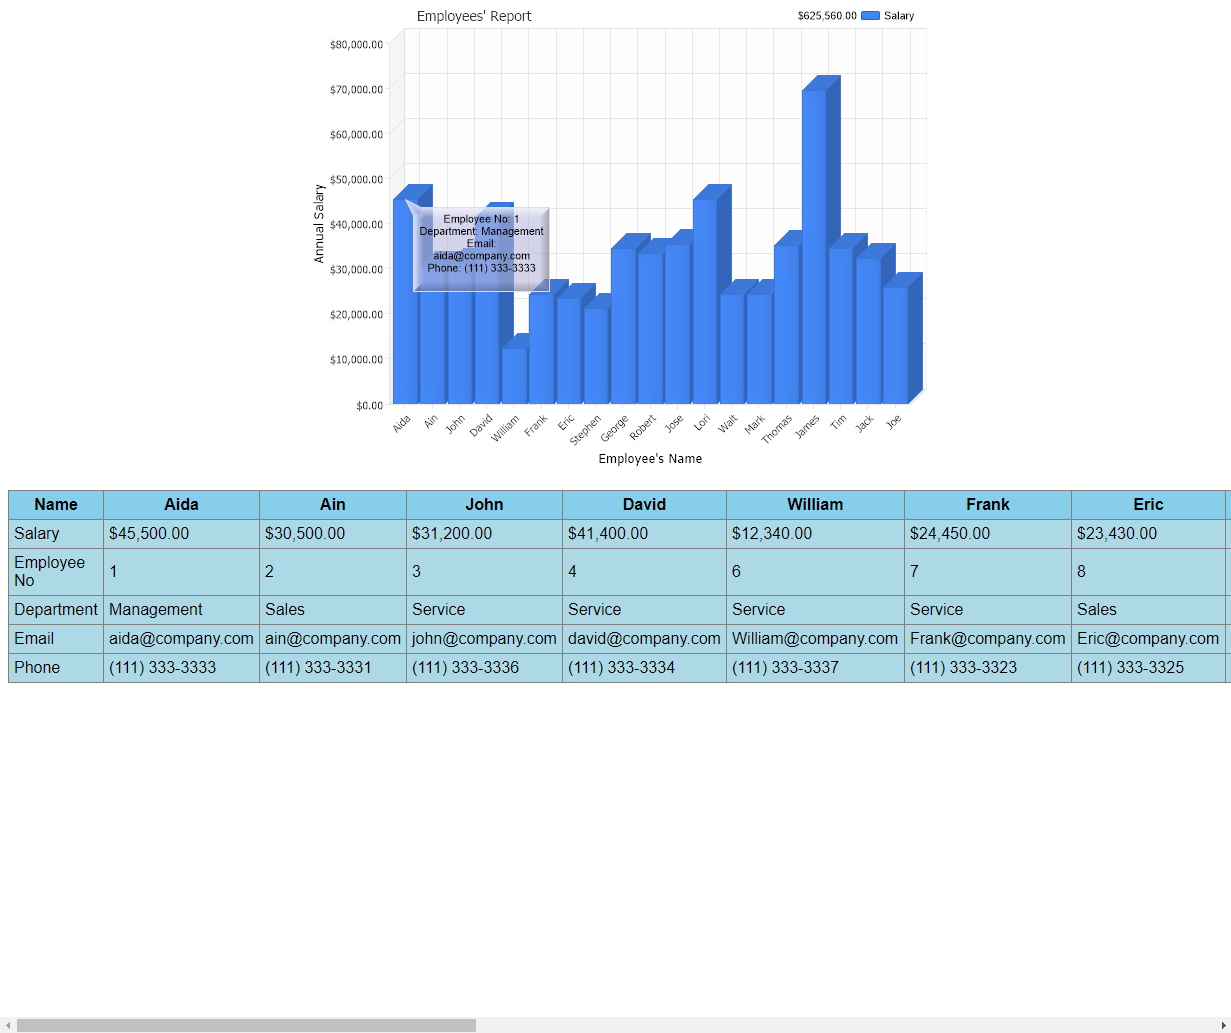
Gridview Custom Attributes
<%@ Page Language="C#" Trace="false" Description="dotnetCHARTING Component" %>
<%@ Register TagPrefix="dotnet" Namespace="dotnetCHARTING" Assembly="dotnetCHARTING" %>
<%@ Import Namespace="System.Drawing" %>
<script runat="server">
void Page_Load(Object sender, EventArgs e)
{
// Demonstrates using custom element attributes inside a GridView.
//set global properties
Chart.Title = " Employees' Report";
Chart.YAxis.FormatString = "Currency";
Chart.TempDirectory = "temp";
Chart.Debug = true;
Chart.Use3D = true;
Chart.XAxis.Label.Text = "Employee's Name";
Chart.YAxis.Label.Text = "Annual Salary";
Chart.DataGrid = "chartgridview";
Chart.DataGridSeriesHeader = "Name";
Chart.DataGridFormatString = "C";
Chart.DataGridCustomAttributes = "Employee No=%EmployeeID<row>Department=%Department<row>Email=%email<row>Phone=%PhoneNumber";
// Transpose switches the rows and columns. To visualize this
// difference, please change this property value and run the sample again.
Chart.DataGridTranspose = false;
//Create a series
DataEngine de = new DataEngine(ConfigurationManager.AppSettings["DNCConnectionString"]);
de.SqlStatement = @"SELECT * FROM Employees";
//Set predefined data fields and some custom fields as attributes for x-Axis. (Employee�s name)
de.DataFields = "xAxis=name,yAxis=salary,id=EmployeeID,department=Department,email,phone=PhoneNumber";
SeriesCollection sc = de.GetSeries();
sc[0].Name = "Salary";
de.Limit = "5";
de.ShowOther = false;
Annotation a = new Annotation("Employee No: %EmployeeID\nDepartment: %Department\nEmail: %email\nPhone: %PhoneNumber");
a.Background.Bevel = true;
a.Background.Color = Color.FromArgb(150, 180, 180, 220);
// Assign the annotation to an element in the sc collection.
sc[0].Elements[0].Annotation = a;
Chart.SeriesCollection.Add(sc);
}
</script>
<html xmlns="http://www.w3.org/1999/xhtml">
<head>
<title>GridView Custom Attributes</title>
</head>
<body>
<div style="text-align: center">
<dotnet:Chart ID="Chart" TitleBox-Position="FullWithLegend" runat="server" />
</div>
<br />
<center>
<form runat="server">
<asp:GridView ID="chartgridview" Width="50%" Font-Name="Arial" HeaderStyle-BackColor="skyblue"
BackColor="lightblue" CellPadding="5" runat="server" />
</form>
</center>
</body>
</html>
<%@ Page Language="vb" Trace="false" Description="dotnetCHARTING Component" %>
<%@ Register TagPrefix="dotnet" Namespace="dotnetCHARTING" Assembly="dotnetCHARTING" %>
<%@ Import Namespace="System.Drawing" %>
<script runat="server">
Sub Page_Load(ByVal sender As Object, ByVal e As EventArgs)
' Demonstrates using custom element attributes inside a GridView.
'set global properties
Chart.Title = " Employees' Report"
Chart.YAxis.FormatString = "Currency"
Chart.TempDirectory = "temp"
Chart.Debug = True
Chart.Use3D = True
Chart.XAxis.Label.Text = "Employee's Name"
Chart.YAxis.Label.Text = "Annual Salary"
Chart.DataGrid = "chartgridview"
Chart.DataGridSeriesHeader = "Name"
Chart.DataGridFormatString = "C"
Chart.DataGridCustomAttributes = "Employee No=%EmployeeID<row>Department=%Department<row>Email=%email<row>Phone=%PhoneNumber"
' Transpose switches the rows and columns. To visualize this
' difference, please change this property value and run the sample again.
Chart.DataGridTranspose = False
'Create a series
Dim de As DataEngine = New DataEngine(ConfigurationManager.AppSettings("DNCConnectionString"))
de.SqlStatement = "SELECT * FROM Employees"
'Set predefined data fields and some custom fields as attributes for x-Axis. (Employee�s name)
de.DataFields = "xAxis=name,yAxis=salary,id=EmployeeID,department=Department,email,phone=PhoneNumber"
Dim sc As SeriesCollection = de.GetSeries()
sc(0).Name = "Salary"
de.Limit = "5"
de.ShowOther = False
Dim a As Annotation = New Annotation("Employee No: %EmployeeID" & Constants.vbLf & "Department: %Department" & Constants.vbLf & "Email: %email" & Constants.vbLf & "Phone: %PhoneNumber")
a.Background.Bevel = True
a.Background.Color = Color.FromArgb(150, 180, 180, 220)
' Assign the annotation to an element in the sc collection.
sc(0).Elements(0).Annotation = a
Chart.SeriesCollection.Add(sc)
End Sub
</script>
<html xmlns="http://www.w3.org/1999/xhtml">
<head>
<title>GridView Custom Attributes</title>
</head>
<body>
<div style="text-align: center">
<dotnet:Chart ID="Chart" TitleBox-Position="FullWithLegend" runat="server" />
</div>
<br />
<center>
<form runat="server">
<asp:GridView ID="chartgridview" Width="50%" Font-Name="Arial" HeaderStyle-BackColor="skyblue"
BackColor="lightblue" CellPadding="5" runat="server" />
</form>
</center>
</body>
</html>
- Sample FilenameGridviewCustomAttributes.aspx
- Version5.1
- Uses DatabaseYes