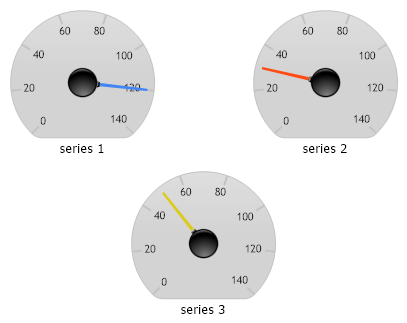
<%@ Page Language="C#" Description="dotnetCHARTING Component" %><%@ Register TagPrefix="dotnet" Namespace="dotnetCHARTING" Assembly="dotnetCHARTING"%><%@ Import Namespace="System.Drawing" %><%@ Import Namespace="System.Drawing.Drawing2D" %><script runat="server">void Page_Load(Object sender,EventArgs e){ // Set the title. //Chart.Title="My Chart"; // Set the directory where images are temporarily be stored. Chart.TempDirectory="temp"; // Disable the legend box Chart.LegendBox.Position = LegendBoxPosition.None; // Set a default gauge face background color. Chart.DefaultSeries.Background.Color = Color.LightGray; // Set he chart size. Chart.Width = 600; Chart.Height = 350; // Specify the gauges chart type Chart.Type = ChartType.Gauges; // Create a series with a single element Series s1 = new Series("series 1",new Element("",120)); // Create a series with a single element Series s2 = new Series("series 2",new Element("",30)); // Create a series with a single element Series s3 = new Series("series 3",new Element("",50)); // Add the series Chart.SeriesCollection.Add(s1); Chart.SeriesCollection.Add(s2); Chart.SeriesCollection.Add(s3); }</script><html xmlns="http://www.w3.org/1999/xhtml"><head><title>Gallery Sample</title></head><body><div style="text-align:center"> <dotnet:Chart id="Chart" runat="server"/></div></body></html>
<%@ Page Language="vb" Description="dotnetCHARTING Component" %><%@ Register TagPrefix="dotnet" Namespace="dotnetCHARTING" Assembly="dotnetCHARTING"%><%@ Import Namespace="System.Drawing" %><%@ Import Namespace="System.Drawing.Drawing2D" %><script runat="server">Sub Page_Load(ByVal sender As Object, ByVal e As EventArgs) ' Set the title. 'Chart.Title="My Chart"; ' Set the directory where images are temporarily be stored. Chart.TempDirectory="temp" ' Disable the legend box Chart.LegendBox.Position = LegendBoxPosition.None ' Set a default gauge face background color. Chart.DefaultSeries.Background.Color = Color.LightGray ' Set he chart size. Chart.Width = 600 Chart.Height = 350 ' Specify the gauges chart type Chart.Type = ChartType.Gauges ' Create a series with a single element Dim s1 As Series = New Series("series 1",New Element("",120)) ' Create a series with a single element Dim s2 As Series = New Series("series 2",New Element("",30)) ' Create a series with a single element Dim s3 As Series = New Series("series 3",New Element("",50)) ' Add the series Chart.SeriesCollection.Add(s1) Chart.SeriesCollection.Add(s2) Chart.SeriesCollection.Add(s3)End Sub</script><html xmlns="http://www.w3.org/1999/xhtml"><head><title>Gallery Sample</title></head><body><div style="text-align:center"> <dotnet:Chart id="Chart" runat="server"/></div></body></html>