Gallery
<%@ Page Language="C#" Description="dotnetCHARTING Component" %>
<%@ Register TagPrefix="dotnet" Namespace="dotnetCHARTING" Assembly="dotnetCHARTING" %>
<%@ Import Namespace="System.Drawing" %>
<%@ Import Namespace="System.Drawing.Drawing2D" %>
<script runat="server">
void Page_Load(Object sender, EventArgs e)
{
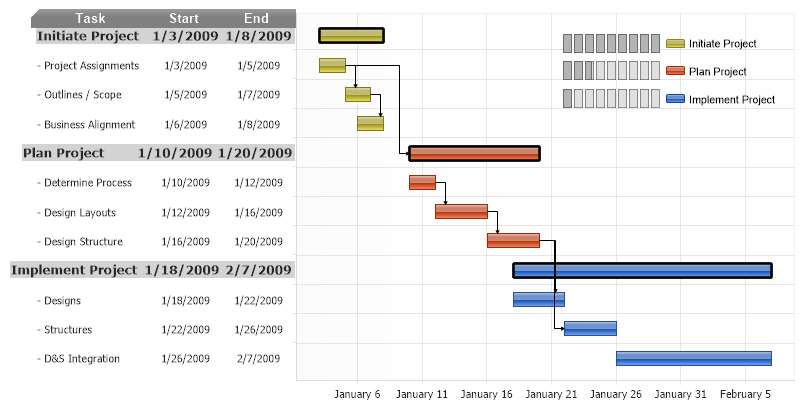
// Demonstrates InfoGrids on the axis and Gantt dependencies.
// These settings ensure each bar fills the entire space per y axis tick.
Chart.Use3D = true;
Chart.Depth = 0;
Chart.YAxis.ClusterColumns = false;
// Specify some styling and other settings
Chart.Type = ChartType.ComboHorizontal;
Chart.Size = "800x400";
Chart.YAxis.CenterTickMarks = false;
Chart.YAxis.SpacingPercentage = 50;
//Chart.YAxis.AlternateGridBackground.Color = Color.FromArgb(80, Color.LightGray);
//Chart.XAxis.AlternateGridBackground.Color = Color.Empty;
Chart.TempDirectory = "temp";
Chart.Debug = true;
Chart.ShadingEffectMode = ShadingEffectMode.Two;
Chart.TitleBox.Padding = 4;
Chart.TitleBox.Background.Color = Color.Gray;
Chart.TitleBox.Label.Color = Color.White;
Chart.LegendBox.Position = new Point(550, 20);
// Create an annotation as a header for the y axis infoGrid.
Annotation an = new Annotation(infoGridSpacing + "Task<block>Start<block>End");
an.Position = new Point(27, 1);
an.Padding = 0;
an.Line.Color = Color.Empty;
an.DynamicSize = false;
an.Background.Color = Color.Gray;
an.Label.Color = Color.White;
an.Label.Font = new Font("Arial", 10, FontStyle.Bold);
Chart.Annotations.Add(an);
// The Series.Line object defines gantt dependency line styles.
Chart.DefaultSeries.Line.Color = Color.Black;
Chart.DefaultSeries.Line.EndCap = LineCap.ArrowAnchor;
Chart.DefaultSeries.Line.AnchorCapScale = 2;
SeriesCollection mySC = getRandomData();
// Add the random data.
Chart.SeriesCollection.Add(mySC);
}
// This string defines the column widths and is used with each y axis tick so that they line up with the header annotation.
string infoGridSpacing = "<Chart:Spacer width='110'><Chart:Spacer width='70'><Chart:Spacer width='70'><row>";
SeriesCollection getRandomData()
{
Element e1 = getGanttElement("- Project Assignments", new DateTime(2009, 1, 3), 2, "");
Element e2 = getGanttElement("- Outlines / Scope", new DateTime(2009, 1, 5), 2, "");
Element e3 = getGanttElement("- Business Alignment", new DateTime(2009, 1, 6), 2, "");
Element e4 = getGanttElement("Initiate Project", new DateTime(2009, 1, 3), 5, "fStyle='Bold' fSize='10' bgColor='LightGray'");
e2.Parent = e1;
e3.Parent = e2;
Series s1 = new Series("", e3, e2, e1, e4);
Element f1 = getGanttElement("Plan Project", new DateTime(2009, 1, 10), 10, "fStyle='Bold' fSize='10' bgColor='LightGray'");
Element f2 = getGanttElement("- Determine Process", new DateTime(2009, 1, 10), 2, "");
Element f3 = getGanttElement("- Design Layouts", new DateTime(2009, 1, 12), 4, "");
Element f4 = getGanttElement("- Design Structure", new DateTime(2009, 1, 16), 4, "");
f1.Parent = e1;
f3.Parent = f2;
f4.Parent = f3;
Series s2 = new Series("", f4, f3, f2, f1);
Element g1 = getGanttElement("Implement Project", new DateTime(2009, 1, 18), 20, "fStyle='Bold' fSize='10' bgColor='LightGray'");
Element g2 = getGanttElement("- Designs", new DateTime(2009, 1, 18), 4, "");
Element g3 = getGanttElement("- Structures", new DateTime(2009, 1, 22), 4, "");
Element g4 = getGanttElement("- D&S Integration", new DateTime(2009, 1, 26), 12, "");
g2.Parent = f4;
g3.Parent = f4;
Series s3 = new Series("", g4, g3, g2, g1);
//Highlight the mainProject bars
decorateMainElement(e4);
decorateMainElement(f1);
decorateMainElement(g1);
// Sets up the legend entry progress bar MicroCharts for each series.
s1.LegendEntry.Value = "<Chart:ProgressGauge value='100' max='100'>";
s1.Name = "Initiate Project";
s1.LegendEntry.SortOrder = 1;
s2.LegendEntry.Value = "<Chart:ProgressGauge value='30' max='100'>";
s2.Name = "Plan Project";
s2.LegendEntry.SortOrder = 2;
s3.LegendEntry.Value = "<Chart:ProgressGauge value='10' max='100'>";
s3.Name = "Implement Project";
s3.LegendEntry.SortOrder = 3;
return new SeriesCollection(s3, s2, s1);
}
// Applies styling to the main top level gantt elements.
void decorateMainElement(Element e)
{
e.Outline.Color = Color.Black;
e.Outline.Width = 2;
}
// Creates an element based on the specified parameters and applies the y axis tick infoGrid
Element getGanttElement(string name, DateTime start, int durationDays, string extras)
{
Element e = new Element(name);
e.YDateTimeStart = start;
e.YDateTime = start.AddDays(durationDays);
e.YAxisTick = new AxisTick();
e.YAxisTick.Label.Text = infoGridSpacing;
e.YAxisTick.Label.Text += "<block hAlign='Left' " + extras + ">" + name + "<block hAlign='Center' " + extras + ">" + e.YDateTimeStart.ToShortDateString() + "<block hAlign='Center' " + extras + ">" + e.YDateTime.ToShortDateString();
return e;
}
</script>
<html xmlns="http://www.w3.org/1999/xhtml">
<head>
<title>.netCHARTING Sample</title>
</head>
<body>
<div align="center">
<dotnet:Chart ID="Chart" runat="server" />
</div>
</body>
</html>
<%@ Page Language="vb" Description="dotnetCHARTING Component" %>
<%@ Register TagPrefix="dotnet" Namespace="dotnetCHARTING" Assembly="dotnetCHARTING" %>
<%@ Import Namespace="System.Drawing" %>
<%@ Import Namespace="System.Drawing.Drawing2D" %>
<script runat="server">
Sub Page_Load(ByVal sender As Object, ByVal e As EventArgs)
' Demonstrates InfoGrids on the axis and Gantt dependencies.
' These settings ensure each bar fills the entire space per y axis tick.
Chart.Use3D = True
Chart.Depth = 0
Chart.YAxis.ClusterColumns = False
' Specify some styling and other settings
Chart.Type = ChartType.ComboHorizontal
Chart.Size = "800x400"
Chart.YAxis.CenterTickMarks = False
Chart.YAxis.SpacingPercentage = 50
'Chart.YAxis.AlternateGridBackground.Color = Color.FromArgb(80, Color.LightGray);
'Chart.XAxis.AlternateGridBackground.Color = Color.Empty;
Chart.TempDirectory = "temp"
Chart.Debug = True
Chart.ShadingEffectMode = ShadingEffectMode.Two
Chart.TitleBox.Padding = 4
Chart.TitleBox.Background.Color = Color.Gray
Chart.TitleBox.Label.Color = Color.White
Chart.LegendBox.Position = New Point(550, 20)
' Create an annotation as a header for the y axis infoGrid.
Dim an As Annotation = New Annotation(infoGridSpacing & "Task<block>Start<block>End")
an.Position = New Point(27, 1)
an.Padding = 0
an.Line.Color = Color.Empty
an.DynamicSize = False
an.Background.Color = Color.Gray
an.Label.Color = Color.White
an.Label.Font = New Font("Arial", 10, FontStyle.Bold)
Chart.Annotations.Add(an)
' The Series.Line object defines gantt dependency line styles.
Chart.DefaultSeries.Line.Color = Color.Black
Chart.DefaultSeries.Line.EndCap = LineCap.ArrowAnchor
Chart.DefaultSeries.Line.AnchorCapScale = 2
Dim mySC As SeriesCollection = getRandomData()
' Add the random data.
Chart.SeriesCollection.Add(mySC)
End Sub
' This string defines the column widths and is used with each y axis tick so that they line up with the header annotation.
Dim infoGridSpacing As String = "<Chart:Spacer width='110'><Chart:Spacer width='70'><Chart:Spacer width='70'><row>"
Function getRandomData() As SeriesCollection
Dim e1 As Element = getGanttElement("- Project Assignments", New DateTime(2009, 1, 3), 2, "")
Dim e2 As Element = getGanttElement("- Outlines / Scope", New DateTime(2009, 1, 5), 2, "")
Dim e3 As Element = getGanttElement("- Business Alignment", New DateTime(2009, 1, 6), 2, "")
Dim e4 As Element = getGanttElement("Initiate Project", New DateTime(2009, 1, 3), 5, "fStyle='Bold' fSize='10' bgColor='LightGray'")
e2.Parent = e1
e3.Parent = e2
Dim s1 As Series = New Series("", e3, e2, e1, e4)
Dim f1 As Element = getGanttElement("Plan Project", New DateTime(2009, 1, 10), 10, "fStyle='Bold' fSize='10' bgColor='LightGray'")
Dim f2 As Element = getGanttElement("- Determine Process", New DateTime(2009, 1, 10), 2, "")
Dim f3 As Element = getGanttElement("- Design Layouts", New DateTime(2009, 1, 12), 4, "")
Dim f4 As Element = getGanttElement("- Design Structure", New DateTime(2009, 1, 16), 4, "")
f1.Parent = e1
f3.Parent = f2
f4.Parent = f3
Dim s2 As Series = New Series("", f4, f3, f2, f1)
Dim g1 As Element = getGanttElement("Implement Project", New DateTime(2009, 1, 18), 20, "fStyle='Bold' fSize='10' bgColor='LightGray'")
Dim g2 As Element = getGanttElement("- Designs", New DateTime(2009, 1, 18), 4, "")
Dim g3 As Element = getGanttElement("- Structures", New DateTime(2009, 1, 22), 4, "")
Dim g4 As Element = getGanttElement("- D&S Integration", New DateTime(2009, 1, 26), 12, "")
g2.Parent = f4
g3.Parent = f4
Dim s3 As Series = New Series("", g4, g3, g2, g1)
'Highlight the mainProject bars
decorateMainElement(e4)
decorateMainElement(f1)
decorateMainElement(g1)
' Sets up the legend entry progress bar MicroCharts for each series.
s1.LegendEntry.Value = "<Chart:ProgressGauge value='100' max='100'>"
s1.Name = "Initiate Project"
s1.LegendEntry.SortOrder = 1
s2.LegendEntry.Value = "<Chart:ProgressGauge value='30' max='100'>"
s2.Name = "Plan Project"
s2.LegendEntry.SortOrder = 2
s3.LegendEntry.Value = "<Chart:ProgressGauge value='10' max='100'>"
s3.Name = "Implement Project"
s3.LegendEntry.SortOrder = 3
Return New SeriesCollection(s3, s2, s1)
End Function
' Applies styling to the main top level gantt elements.
Sub decorateMainElement(ByVal e As Element)
e.Outline.Color = Color.Black
e.Outline.Width = 2
End Sub
' Creates an element based on the specified parameters and applies the y axis tick infoGrid
Function getGanttElement(ByVal name As String, ByVal start As DateTime, ByVal durationDays As Integer, ByVal extras As String) As Element
Dim e As Element = New Element(name)
e.YDateTimeStart = start
e.YDateTime = start.AddDays(durationDays)
e.YAxisTick = New AxisTick()
e.YAxisTick.Label.Text = infoGridSpacing
e.YAxisTick.Label.Text &= "<block hAlign='Left' " & extras & ">" & name & "<block hAlign='Center' " & extras & ">" & e.YDateTimeStart.ToShortDateString() & "<block hAlign='Center' " & extras & ">" & e.YDateTime.ToShortDateString()
Return e
End Function
</script>
<html xmlns="http://www.w3.org/1999/xhtml">
<head>
<title>.netCHARTING Sample</title>
</head>
<body>
<div align="center">
<dotnet:Chart ID="Chart" runat="server" />
</div>
</body>
</html>
- Sample FilenameGanttDependencies2.aspx
- Version5.2
- Uses DatabaseNo