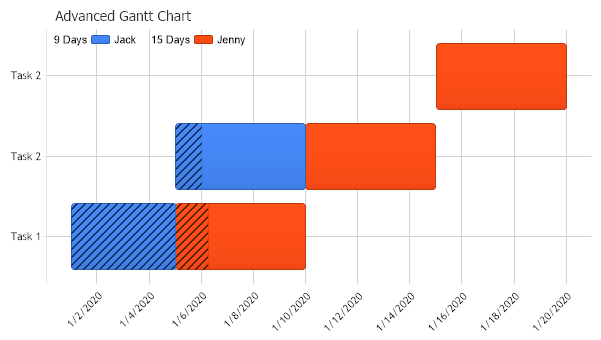
Gantt Advanced
This sample will take advantage of an invisible y axis to place two series on the same column.
<%@ Page Language="C#" Description="dotnetCHARTING Component" %>
<%@ Register TagPrefix="dotnet" Namespace="dotnetCHARTING" Assembly="dotnetCHARTING"%>
<%@ Import Namespace="System.Drawing" %>
<html xmlns="http://www.w3.org/1999/xhtml">
<head>
<title>Gallery Sample (Time Gantt Chart in 2D)</title>
<script runat="server">
void Page_Load(Object sender,EventArgs e)
{
Chart.Type = ChartType.ComboHorizontal;
Chart.Width = 600;
Chart.Height = 350;
Chart.Debug = true;
Chart.TempDirectory = "temp";
Chart.Title = "Advanced Gantt Chart";
Chart.LegendBox.Position = LegendBoxPosition.ChartArea;
// This sample will take advantage of an invisible y axis to place two series on the same column. Without
// two axes, the elements would appear side by side.
// *DYNAMIC DATA NOTE*
// This sample uses static data to populate the chart. To populate
// a chart with database data see the following resources:
// - Classic samples folder
// - Help File > Data Tutorials
// - Sample: features/DataEngine.aspx
SeriesCollection sc = getData();
// Because the series dont have the same number of elements and are on two different category* axes the
// columns will be offset. To remedy this we'll group the seriescollection by names. This will make the two
// seires have the same number of elements with like names.
sc.GroupByElements();
// We'll give the second series a new axis so it's not drawn side by side the with the first one and clear it
// so it's not visible.
sc[1].YAxis = new Axis();
sc[1].YAxis.Clear();
// Add the random data.
Chart.SeriesCollection.Add(sc);
// * Category axes are ones that display element names.
}
SeriesCollection getData()
{
// Create two series one for Jack and Jenny. Notice Jack only has two tasks while Jenny has three.
SeriesCollection SC = new SeriesCollection();
Series s1 = new Series("Jack");
Series s2 = new Series("Jenny");
Element e1 = new Element();
e1.Name = "Task 1";
e1.YDateTimeStart = new DateTime(2020,1,1);
e1.YDateTime = new DateTime(2020,1,5);
e1.Complete = 100;
Element e2 = new Element();
e2.Name = "Task 2";
e2.YDateTimeStart = new DateTime(2020,1,5);
e2.YDateTime = new DateTime(2020,1,10);
e2.Complete = 20;
s1.Elements.Add(e1);
s1.Elements.Add(e2);
Element e3 = new Element();
e3.Name = "Task 1";
e3.YDateTimeStart = new DateTime(2020,1,5);
e3.YDateTime = new DateTime(2020,1,10);
e3.Complete = 25;
Element e4 = new Element();
e4.Name = "Task 2";
e4.YDateTimeStart = new DateTime(2020,1,10);
e4.YDateTime = new DateTime(2020,1,15);
Element e5 = new Element();
e5.Name = "Task 2";
e5.YDateTimeStart = new DateTime(2020,1,15);
e5.YDateTime = new DateTime(2020,1,20);
s2.Elements.Add(e3);
s2.Elements.Add(e4);
s2.Elements.Add(e5);
SC.Add(s1);
SC.Add(s2);
return SC;
}
</script>
</head>
<body>
<div style="text-align:center">
<dotnet:Chart id="Chart" runat="server" Width="568px" Height="344px">
</dotnet:Chart>
</div>
</body>
</html>
<%@ Page Language="vb" Description="dotnetCHARTING Component" %>
<%@ Register TagPrefix="dotnet" Namespace="dotnetCHARTING" Assembly="dotnetCHARTING"%>
<%@ Import Namespace="System.Drawing" %>
<html xmlns="http://www.w3.org/1999/xhtml">
<head>
<title>Gallery Sample (Time Gantt Chart in 2D)</title>
<script runat="server">
Sub Page_Load(ByVal sender As Object, ByVal e As EventArgs)
Chart.Type = ChartType.ComboHorizontal
Chart.Width = 600
Chart.Height = 350
Chart.Debug = True
Chart.TempDirectory = "temp"
Chart.Title = "Advanced Gantt Chart"
Chart.LegendBox.Position = LegendBoxPosition.ChartArea
' This sample will take advantage of an invisible y axis to place two series on the same column. Without
' two axes, the elements would appear side by side.
' *DYNAMIC DATA NOTE*
' This sample uses static data to populate the chart. To populate
' a chart with database data see the following resources:
' - Classic samples folder
' - Help File > Data Tutorials
' - Sample: features/DataEngine.aspx
Dim sc As SeriesCollection = getData()
' Because the series dont have the same number of elements and are on two different category* axes the
' columns will be offset. To remedy this we'll group the seriescollection by names. This will make the two
' seires have the same number of elements with like names.
sc.GroupByElements()
' We'll give the second series a new axis so it's not drawn side by side the with the first one and clear it
' so it's not visible.
sc(1).YAxis = New Axis()
sc(1).YAxis.Clear()
' Add the random data.
Chart.SeriesCollection.Add(sc)
' * Category axes are ones that display element names.
End Sub
Function getData() As SeriesCollection
' Create two series one for Jack and Jenny. Notice Jack only has two tasks while Jenny has three.
Dim SC As SeriesCollection = New SeriesCollection()
Dim s1 As Series = New Series("Jack")
Dim s2 As Series = New Series("Jenny")
Dim e1 As Element = New Element()
e1.Name = "Task 1"
e1.YDateTimeStart = New DateTime(2020,1,1)
e1.YDateTime = New DateTime(2020,1,5)
e1.Complete = 100
Dim e2 As Element = New Element()
e2.Name = "Task 2"
e2.YDateTimeStart = New DateTime(2020,1,5)
e2.YDateTime = New DateTime(2020,1,10)
e2.Complete = 20
s1.Elements.Add(e1)
s1.Elements.Add(e2)
Dim e3 As Element = New Element()
e3.Name = "Task 1"
e3.YDateTimeStart = New DateTime(2020,1,5)
e3.YDateTime = New DateTime(2020,1,10)
e3.Complete = 25
Dim e4 As Element = New Element()
e4.Name = "Task 2"
e4.YDateTimeStart = New DateTime(2020,1,10)
e4.YDateTime = New DateTime(2020,1,15)
Dim e5 As Element = New Element()
e5.Name = "Task 2"
e5.YDateTimeStart = New DateTime(2020,1,15)
e5.YDateTime = New DateTime(2020,1,20)
s2.Elements.Add(e3)
s2.Elements.Add(e4)
s2.Elements.Add(e5)
SC.Add(s1)
SC.Add(s2)
Return SC
End Function
</script>
</head>
<body>
<div style="text-align:center">
<dotnet:Chart id="Chart" runat="server" Width="568px" Height="344px">
</dotnet:Chart>
</div>
</body>
</html>