Gallery
Data Grid Data Engine
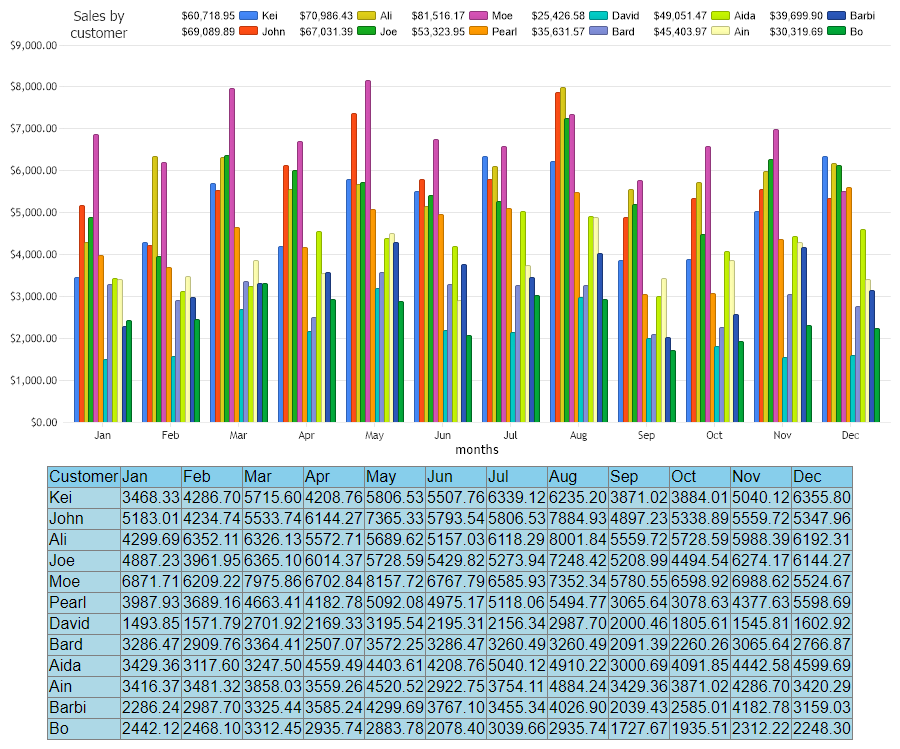
<%@ Page Language="C#" Description="dotnetCHARTING Component"%>
<%@ Register TagPrefix="dotnet" Namespace="dotnetCHARTING" Assembly="dotnetCHARTING"%>
<%@ Import Namespace="System.Drawing" %>
<script runat="server">
void Page_Load(Object sender,EventArgs e)
{
// Demonstrates how to pupulate chart data to a DataGrid using DataEngine object.
//set global properties
Chart.Title="Sales by customer";
Chart.Size="900x480";
Chart.XAxis.Label.Text ="months";
Chart.YAxis.FormatString="currency";
Chart.TempDirectory="temp";
Chart.TitleBox.Position = TitleBoxPosition.FullWithLegend;
//Create DataEngine and set properties
DataEngine de = new DataEngine();
de.ConnectionString = ConfigurationManager.AppSettings["DNCConnectionString"];
de.StartDate=new DateTime (2022,1,1,0,0,0);
de.EndDate = new DateTime (2022,12,31,23,59,59);
de.DateGrouping = TimeInterval.Year;
de.SqlStatement= @"SELECT OrderDate,Sum(Total) As Total, Name FROM Orders WHERE OrderDate >= #STARTDATE# AND OrderDate <= #ENDDATE# Group by Name, OrderDate ORDER BY OrderDate";
//set DataGrid property
de.DataGrid= dataGridControl;
de.DataGridSeriesHeader = "Customer";
de.DataGridTranspose=false;
de.DataGridFormatString ="0.00";
//Create series collection by DataEngine
SeriesCollection sc = de.GetSeries();
Chart.SeriesCollection.Add(sc);
}
</script>
<html xmlns="http://www.w3.org/1999/xhtml">
<head>
<title>DataGrid with DataEngine Sample</title>
</head>
<body>
<div align="center">
<dotnet:Chart id="Chart" visible="true" runat="server"/>
<asp:DataGrid id="dataGridControl" Width="50%" Font-Name="Arial" HeaderStyle-BackColor="skyblue"
BackColor="lightblue" runat="server"/>
</div>
</body>
</html>
<%@ Page Language="vb" Description="dotnetCHARTING Component"%>
<%@ Register TagPrefix="dotnet" Namespace="dotnetCHARTING" Assembly="dotnetCHARTING"%>
<%@ Import Namespace="System.Drawing" %>
<script runat="server">
Sub Page_Load(ByVal sender As Object, ByVal e As EventArgs)
' Demonstrates how to pupulate chart data to a DataGrid using DataEngine object.
'set global properties
Chart.Title="Sales by customer"
Chart.Size="900x480"
Chart.XAxis.Label.Text ="months"
Chart.YAxis.FormatString="currency"
Chart.TempDirectory="temp"
Chart.TitleBox.Position = TitleBoxPosition.FullWithLegend
'Create DataEngine and set properties
Dim de As DataEngine = New DataEngine()
de.ConnectionString = ConfigurationManager.AppSettings("DNCConnectionString")
de.StartDate = New DateTime (2022,1,1,0,0,0)
de.EndDate = New DateTime (2022,12,31,23,59,59)
de.DateGrouping = TimeInterval.Year
de.SqlStatement= "SELECT OrderDate,Sum(Total) As Total, Name FROM Orders WHERE OrderDate >= #STARTDATE# AND OrderDate <= #ENDDATE# Group by Name, OrderDate ORDER BY OrderDate"
'set DataGrid property
de.DataGrid= dataGridControl
de.DataGridSeriesHeader = "Customer"
de.DataGridTranspose=False
de.DataGridFormatString ="0.00"
'Create series collection by DataEngine
Dim sc As SeriesCollection = de.GetSeries()
Chart.SeriesCollection.Add(sc)
End Sub
</script>
<html xmlns="http://www.w3.org/1999/xhtml">
<head>
<title>DataGrid with DataEngine Sample</title>
</head>
<body>
<div align="center">
<dotnet:Chart id="Chart" visible="true" runat="server"/>
<asp:DataGrid id="dataGridControl" Width="50%" Font-Name="Arial" HeaderStyle-BackColor="skyblue"
BackColor="lightblue" runat="server"/>
</div>
</body>
</html>
- Sample FilenameDataGridDataEngine.aspx
- Version4.2
- Uses DatabaseYes