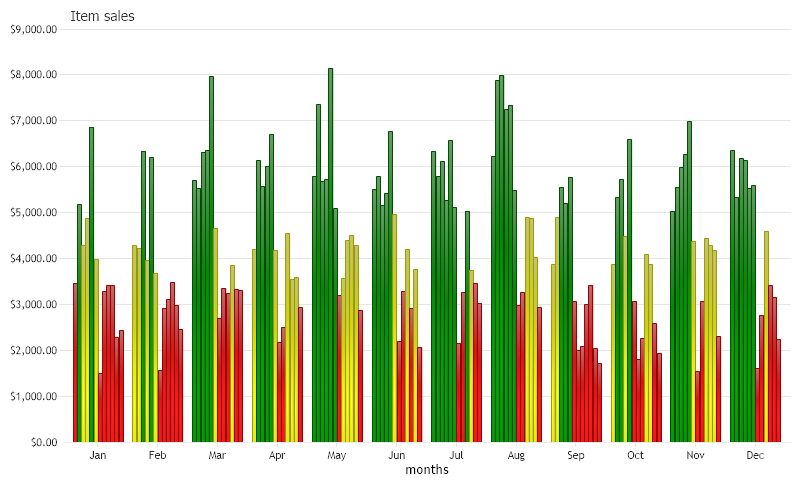
Gallery
Data Engine
<%@ Page Language="C#" Description="dotnetCHARTING Component"%>
<%@ Register TagPrefix="dotnet" Namespace="dotnetCHARTING" Assembly="dotnetCHARTING"%>
<%@ Import Namespace="System.Drawing" %>
<script runat="server">
void Page_Load(Object sender,EventArgs e)
{
//set global properties
Chart.Title="Item sales";
Chart.XAxis.Label.Text ="months";
Chart.YAxis.FormatString="currency";
Chart.TempDirectory="temp";
Chart.Debug=true;
Chart.ShadingEffect = true;
Chart.LegendBox.Position = LegendBoxPosition.None;
Chart.Size="800X500";
Chart.DefaultSeries.DefaultElement.ToolTip = "%yValue";
//Add a series
DataEngine de = new DataEngine();
de.ConnectionString = ConfigurationManager.AppSettings["DNCConnectionString"];
de.StartDate=new DateTime (2022,1,1,0,0,0);
de.EndDate = new DateTime (2022,12,31,23,59,59);
de.DateGrouping = TimeInterval.Year;
de.SqlStatement= @"SELECT OrderDate,Total, Name FROM Orders WHERE OrderDate >= #STARTDATE# AND OrderDate <= #ENDDATE# ORDER BY OrderDate";
SeriesCollection sc = de.GetSeries();
// customize element settings
//set the color for different customers in each month based on their total sale.
foreach(dotnetCHARTING.Series sr in sc)
{
foreach(dotnetCHARTING.Element el in sr.Elements)
{
if (el.YValue < 3500)
{
el.Color = Color.Red;
}
else if (el.YValue < 5000)
{
el.Color = Color.Yellow;
}
else
{
el.Color = Color.Green;
}
}
}
Chart.SeriesCollection.Add(sc);
}
</script>
<html xmlns="http://www.w3.org/1999/xhtml">
<head>
<title>Data Engine Sample</title>
</head>
<body>
<div style="text-align:center">
<dotnet:Chart id="Chart" runat="server"/>
</div>
</body>
</html>
<%@ Page Language="vb" Description="dotnetCHARTING Component"%>
<%@ Register TagPrefix="dotnet" Namespace="dotnetCHARTING" Assembly="dotnetCHARTING"%>
<%@ Import Namespace="System.Drawing" %>
<script runat="server">
Sub Page_Load(ByVal sender As Object, ByVal e As EventArgs)
'set global properties
Chart.Title="Item sales"
Chart.XAxis.Label.Text ="months"
Chart.YAxis.FormatString="currency"
Chart.TempDirectory="temp"
Chart.Debug=True
Chart.ShadingEffect = True
Chart.LegendBox.Position = LegendBoxPosition.None
Chart.Size="800X500"
Chart.DefaultSeries.DefaultElement.ToolTip = "%yValue"
'Add a series
Dim de As DataEngine = New DataEngine()
de.ConnectionString = ConfigurationManager.AppSettings("DNCConnectionString")
de.StartDate = New DateTime (2022,1,1,0,0,0)
de.EndDate = New DateTime (2022,12,31,23,59,59)
de.DateGrouping = TimeInterval.Year
de.SqlStatement= "SELECT OrderDate,Total, Name FROM Orders WHERE OrderDate >= #STARTDATE# AND OrderDate <= #ENDDATE# ORDER BY OrderDate"
Dim sc As SeriesCollection = de.GetSeries()
' customize element settings
'set the color for different customers in each month based on their total sale.
For Each sr As dotnetCHARTING.Series In sc
For Each el As dotnetCHARTING.Element In sr.Elements
If el.YValue < 3500 Then
el.Color = Color.Red
ElseIf el.YValue < 5000 Then
el.Color = Color.Yellow
Else
el.Color = Color.Green
End If
Next el
Next sr
Chart.SeriesCollection.Add(sc)
End Sub
</script>
<html xmlns="http://www.w3.org/1999/xhtml">
<head>
<title>Data Engine Sample</title>
</head>
<body>
<div style="text-align:center">
<dotnet:Chart id="Chart" runat="server"/>
</div>
</body>
</html>
- Sample FilenameDataEngine.aspx
- VersionLegacy (Pre 3.0)
- Uses DatabaseYes