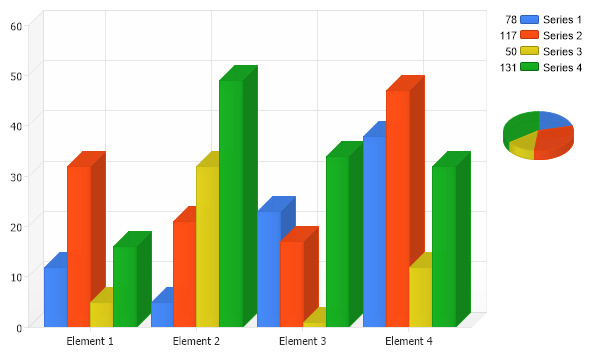
Gallery
Combo With Pie
<%@ Page Language="C#" Description="dotnetCHARTING Component" %>
<%@ Register TagPrefix="dotnet" Namespace="dotnetCHARTING" Assembly="dotnetCHARTING" %>
<%@ Import Namespace="System.Drawing" %>
<%@ Import Namespace="System.Drawing.Drawing2D" %>
<%@ Import Namespace="dotnetCHARTING.Mapping" %>
<script runat="server">
void Page_Load(Object sender, EventArgs e)
{
// Demonstrates generating a sum pie chart image and inserting it into the legend.
Chart.TempDirectory = "temp";
Chart.Debug = true;
Chart.Type = ChartType.Combo;
Chart.Size = "600x350";
//Chart.Title = ".netCHARTING Sample";
Chart.Use3D = true;
// *DYNAMIC DATA NOTE*
// This sample uses random data to populate the chart. To populate
// a chart with database data see the following resources:
// - Help File > Getting Started > Data Tutorials
// - DataEngine Class in the help file
// - Sample: features/DataEngine.aspx
SeriesCollection mySC = getRandomData();
LegendEntry le = new LegendEntry(" ", " ");
le.PaddingTop = 52;
Chart.LegendBox.ExtraEntries.Add(le);
Annotation an = new Annotation();
an.ClearColors();
System.Drawing.Image pie = getPieImage(mySC);
TextureBrush tb = new TextureBrush(pie);
tb.TranslateTransform(500, 96);
an.Background = new Background(tb);
an.Position = new Point(500, 96);
an.Size = new Size(80, 60);
Chart.Annotations.Add(an);
// Add the random data.
Chart.SeriesCollection.Add(mySC);
pie.Dispose();
//tb.Dispose();
}
SeriesCollection getRandomData()
{
Random myR = new Random(1);
SeriesCollection SC = new SeriesCollection();
for (int a = 1; a < 5; a++)
{
Series s = new Series("Series " + a.ToString());
for (int b = 1; b < 5; b++)
{
Element e = new Element("Element " + b.ToString());
e.YValue = myR.Next(50);
s.Elements.Add(e);
}
SC.Add(s);
}
return SC;
}
System.Drawing.Image getPieImage(SeriesCollection sc)
{
Chart c = new Chart();
c.Type = ChartType.Pie;
c.Palette = ChartPalettes.GetPalette(Palette.Default);
c.Size = "80x70";
c.Use3D = true;
c.Margin = "-12";
c.LegendBox.Visible = false;
c.Background.Color = Color.Transparent;
c.ChartArea.ClearColors();
c.SeriesCollection.Add(sc);
return c.GetChartBitmap();
}
</script>
<html xmlns="http://www.w3.org/1999/xhtml">
<head>
<title>.netCHARTING Sample</title>
</head>
<body>
<div align="center">
<dotnet:Chart ID="Chart" runat="server" />
</div>
</body>
</html>
<%@ Page Language="vb" Description="dotnetCHARTING Component" %>
<%@ Register TagPrefix="dotnet" Namespace="dotnetCHARTING" Assembly="dotnetCHARTING" %>
<%@ Import Namespace="System.Drawing" %>
<%@ Import Namespace="System.Drawing.Drawing2D" %>
<%@ Import Namespace="dotnetCHARTING.Mapping" %>
<script runat="server">
Sub Page_Load(ByVal sender As Object, ByVal e As EventArgs)
' Demonstrates generating a sum pie chart image and inserting it into the legend.
Chart.TempDirectory = "temp"
Chart.Debug = True
Chart.Type = ChartType.Combo
Chart.Size = "600x350"
'Chart.Title = ".netCHARTING Sample";
Chart.Use3D = True
' *DYNAMIC DATA NOTE*
' This sample uses random data to populate the chart. To populate
' a chart with database data see the following resources:
' - Help File > Getting Started > Data Tutorials
' - DataEngine Class in the help file
' - Sample: features/DataEngine.aspx
Dim mySC As SeriesCollection = getRandomData()
Dim le As LegendEntry = New LegendEntry(" ", " ")
le.PaddingTop = 52
Chart.LegendBox.ExtraEntries.Add(le)
Dim an As Annotation = New Annotation()
an.ClearColors()
Dim pie As System.Drawing.Image = getPieImage(mySC)
Dim tb As TextureBrush = New TextureBrush(pie)
tb.TranslateTransform(500, 96)
an.Background = New Background(tb)
an.Position = New Point(500, 96)
an.Size = New Size(80, 60)
Chart.Annotations.Add(an)
' Add the random data.
Chart.SeriesCollection.Add(mySC)
pie.Dispose()
'tb.Dispose();
End Sub
Function getRandomData() As SeriesCollection
Dim myR As Random = New Random(1)
Dim SC As SeriesCollection = New SeriesCollection()
For a As Integer = 1 To 4
Dim s As Series = New Series("Series " & a.ToString())
For b As Integer = 1 To 4
Dim e As Element = New Element("Element " & b.ToString())
e.YValue = myR.Next(50)
s.Elements.Add(e)
Next b
SC.Add(s)
Next a
Return SC
End Function
Function getPieImage(ByVal sc As SeriesCollection) As System.Drawing.Image
Dim c As Chart = New Chart()
c.Type = ChartType.Pie
c.Palette = ChartPalettes.GetPalette(Palette.Default)
c.Size = "80x70"
c.Use3D = True
c.Margin = "-12"
c.LegendBox.Visible = False
c.Background.Color = Color.Transparent
c.ChartArea.ClearColors()
c.SeriesCollection.Add(sc)
Return c.GetChartBitmap()
End Function
</script>
<html xmlns="http://www.w3.org/1999/xhtml">
<head>
<title>.netCHARTING Sample</title>
</head>
<body>
<div align="center">
<dotnet:Chart ID="Chart" runat="server" />
</div>
</body>
</html>
- Sample FilenameComboWithPie.aspx
- Version4.3
- Uses DatabaseNo