SeriesCollection getRandomData() { SeriesCollection SC = new SeriesCollection(); Random myR = new Random(); for(int a = 1; a < 5; a++) { Series s = new Series(); s.Name = "Series " + a; for(int b = 1; b < 8; b++) { Element e = new Element(); e.Name = "E " + b; e.YValue = myR.Next(50); s.Elements.Add(e); } SC.Add(s); }
return SC; }
void Page_Load(Object sender,EventArgs e) {
// Set the title. //Chart.Title="My Chart";
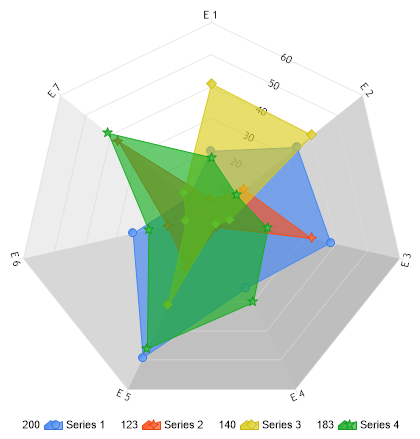
// Set the chart Type Chart.Type = ChartType.Radar;
// Set 3D Chart.Use3D = true; //Chart.XAxis.AlternateGridBackground.Color = Color.Red; //Chart.YAxis.AlternateGridBackground.Color = Color.Green; ;// Color.FromArgb(50, 220, 220, 220); // Set default transparency Chart.DefaultSeries.DefaultElement.Transparency = 35; //Chart.ChartArea.Background.Color = Color.White;//.FromArgb(200,248, 248, 248); // Set the radar labeling mode Chart.RadarLabelMode = RadarLabelMode.Angled; Chart.LegendBox.Orientation = dotnetCHARTING.Orientation.Bottom; // Set the directory where the images will be stored. Chart.TempDirectory="temp";
// Set he chart size. Chart.Width = 600; Chart.Height = 450;
// Add the random data. Chart.SeriesCollection.Add(getRandomData());
Function getRandomData() As SeriesCollection Dim SC As SeriesCollection = New SeriesCollection() Dim myR As Random = New Random() For a As Integer = 1 To 4 Dim s As Series = New Series() s.Name = "Series " & a For b As Integer = 1 To 7 Dim e As Element = New Element() e.Name = "E " & b e.YValue = myR.Next(50) s.Elements.Add(e) Next b SC.Add(s) Next a
Return SC End Function
Sub Page_Load(ByVal sender As Object, ByVal e As EventArgs)
' Set the title. 'Chart.Title="My Chart";
' Set the chart Type Chart.Type = ChartType.Radar
' Set 3D Chart.Use3D = True 'Chart.XAxis.AlternateGridBackground.Color = Color.Red; 'Chart.YAxis.AlternateGridBackground.Color = Color.Green; ;// Color.FromArgb(50, 220, 220, 220); ' Set default transparency Chart.DefaultSeries.DefaultElement.Transparency = 35 'Chart.ChartArea.Background.Color = Color.White;//.FromArgb(200,248, 248, 248); ' Set the radar labeling mode Chart.RadarLabelMode = RadarLabelMode.Angled Chart.LegendBox.Orientation = dotnetCHARTING.Orientation.Bottom ' Set the directory where the images will be stored. Chart.TempDirectory="temp"
' Set he chart size. Chart.Width = 600 Chart.Height = 450
' Add the random data. Chart.SeriesCollection.Add(getRandomData())
End Sub </script> <html xmlns="http://www.w3.org/1999/xhtml"><head><title>Gallery Sample</title></head> <body> <div style="text-align:center"> <dotnet:Chart id="Chart" runat="server"/> </div> </body> </html>