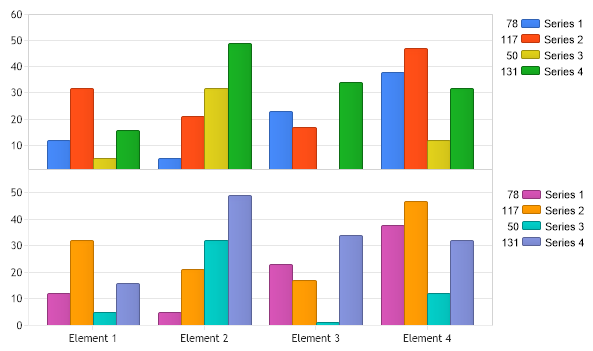
Gallery
Close ChartAreas
<%@ Page Language="C#" Description="dotnetCHARTING Component" %>
<%@ Register TagPrefix="dotnet" Namespace="dotnetCHARTING" Assembly="dotnetCHARTING" %>
<%@ Import Namespace="System.Drawing" %>
<%@ Import Namespace="System.Drawing.Drawing2D" %>
<script runat="server">
void Page_Load(Object sender, EventArgs e)
{
// Demonstrates how to place two chart areas without any padding between them.
Chart.TempDirectory = "temp";
Chart.Debug = true;
Chart.Type = ChartType.Combo;
Chart.Size = "600x350";
//Chart.Title = ".netCHARTING Sample";
Chart.LegendBox.Visible = true;
Chart.DefaultChartArea.Line.Color = Color.LightGray;
// Add the additional chart area to the chart.
ChartArea ca = new ChartArea(getRandomData());
ca.YAxis = new Axis();
ca.LegendBox.Position = new Point(492, 182);
Chart.ExtraChartAreas.Add(ca);
// Eliminate the default chart area spacing.
Chart.ChartAreaSpacing = 0;
// This is still not enough because the y axis tick labels hang over the sides which causes the
// chart areas to push apart. The way around this is to eliminate the y axis ticks that are hanging out.
Chart.YAxis.ExtraTicks.Add(new AxisTick(0, ""));
ca.YAxis.ExtraTicks.Add(new AxisTick(60, ""));
// Alternatively, this method can also be used where the axis min and max are manipulated to
// be just before and after those ticks occur. Either method will work without the other.
Chart.YAxis.Minimum = 1;
ca.YAxis.Maximum = 59;
// *DYNAMIC DATA NOTE*
// This sample uses random data to populate the chart. To populate
// a chart with database data see the following resources:
// - Help File > Getting Started > Data Tutorials
// - DataEngine Class in the help file
// - Sample: features/DataEngine.aspx
SeriesCollection mySC = getRandomData();
// Add the random data.
Chart.SeriesCollection.Add(mySC);
}
SeriesCollection getRandomData()
{
Random myR = new Random(1);
SeriesCollection SC = new SeriesCollection();
int a = 0;
int b = 0;
for (a = 1; a < 5; a++)
{
Series s = new Series("Series " + a.ToString());
for (b = 1; b < 5; b++)
{
Element e = new Element("Element " + b.ToString());
e.YValue = myR.Next(50);
s.Elements.Add(e);
}
SC.Add(s);
}
return SC;
}
SeriesCollection getLiveData()
{
DataEngine de = new DataEngine("ConnectionString goes here");
de.ChartObject = Chart; // Necessary to view any errors the dataEngine may throw.
de.SqlStatement = "SELECT XAxisColumn, YAxisColumn FROM ....";
return de.GetSeries();
}
</script>
<html xmlns="http://www.w3.org/1999/xhtml">
<head>
<title>.netCHARTING Sample</title>
</head>
<body>
<div align="center">
<dotnet:Chart ID="Chart" runat="server" />
</div>
</body>
</html>
<%@ Page Language="vb" Description="dotnetCHARTING Component" %>
<%@ Register TagPrefix="dotnet" Namespace="dotnetCHARTING" Assembly="dotnetCHARTING" %>
<%@ Import Namespace="System.Drawing" %>
<%@ Import Namespace="System.Drawing.Drawing2D" %>
<script runat="server">
Sub Page_Load(ByVal sender As Object, ByVal e As EventArgs)
' Demonstrates how to place two chart areas without any padding between them.
Chart.TempDirectory = "temp"
Chart.Debug = True
Chart.Type = ChartType.Combo
Chart.Size = "600x350"
'Chart.Title = ".netCHARTING Sample";
Chart.LegendBox.Visible = True
Chart.DefaultChartArea.Line.Color = Color.LightGray
' Add the additional chart area to the chart.
Dim ca As ChartArea = New ChartArea(getRandomData())
ca.YAxis = New Axis()
ca.LegendBox.Position = New Point(492, 182)
Chart.ExtraChartAreas.Add(ca)
' Eliminate the default chart area spacing.
Chart.ChartAreaSpacing = 0
' This is still not enough because the y axis tick labels hang over the sides which causes the
' chart areas to push apart. The way around this is to eliminate the y axis ticks that are hanging out.
Chart.YAxis.ExtraTicks.Add(New AxisTick(0, ""))
ca.YAxis.ExtraTicks.Add(New AxisTick(60, ""))
' Alternatively, this method can also be used where the axis min and max are manipulated to
' be just before and after those ticks occur. Either method will work without the other.
Chart.YAxis.Minimum = 1
ca.YAxis.Maximum = 59
' *DYNAMIC DATA NOTE*
' This sample uses random data to populate the chart. To populate
' a chart with database data see the following resources:
' - Help File > Getting Started > Data Tutorials
' - DataEngine Class in the help file
' - Sample: features/DataEngine.aspx
Dim mySC As SeriesCollection = getRandomData()
' Add the random data.
Chart.SeriesCollection.Add(mySC)
End Sub
Function getRandomData() As SeriesCollection
Dim myR As Random = New Random(1)
Dim SC As SeriesCollection = New SeriesCollection()
Dim a As Integer = 0
Dim b As Integer = 0
For a = 1 To 4
Dim s As Series = New Series("Series " & a.ToString())
For b = 1 To 4
Dim e As Element = New Element("Element " & b.ToString())
e.YValue = myR.Next(50)
s.Elements.Add(e)
Next b
SC.Add(s)
Next a
Return SC
End Function
Function getLiveData() As SeriesCollection
Dim de As DataEngine = New DataEngine("ConnectionString goes here")
de.ChartObject = Chart ' Necessary to view any errors the dataEngine may throw.
de.SqlStatement = "SELECT XAxisColumn, YAxisColumn FROM ...."
Return de.GetSeries()
End Function
</script>
<html xmlns="http://www.w3.org/1999/xhtml">
<head>
<title>.netCHARTING Sample</title>
</head>
<body>
<div align="center">
<dotnet:Chart ID="Chart" runat="server" />
</div>
</body>
</html>
- Sample FilenameCloseChartAreas.aspx
- Version4.4
- Uses DatabaseNo