- JS Circular Marker Slider
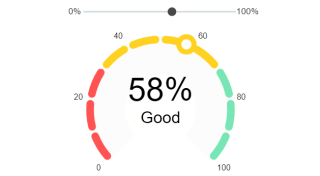
Demonstrates an interactive gauge with axis line breaks and a data point on top of the axis line.
- JS Circular Marker Styles
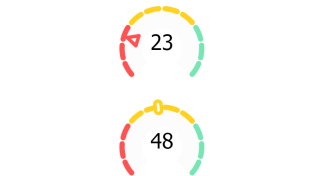
Demonstrates Gauge with styled axis line breaks and a data point on top of the axis line.
- JS Circular Marker
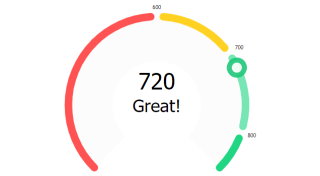
Demonstrates circular Gauge with axis line breaks and a point on top of the axis line.
- JS Circular Marker Gauge
Demonstrates circular Gauge with axis line breaks and a point on top of the axis line.
- JS Circular Mixed Gauges
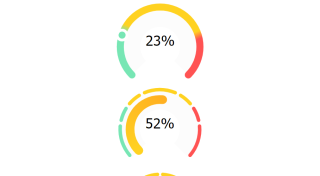
Demonstrates circular gauges with differing styles combined into a single chart.
- JS Circular Column Grid
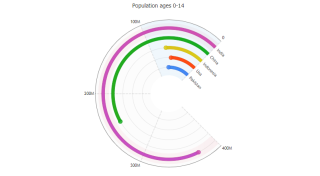
Demonstrates using axis options with circular gauges.
- JS Circular Icons
Demonstrates using shape labels with icons on circular column charts.
- JS Circular Shape Labels
Demonstrates using multiple shape labels on a single circular gauge column chart.
- JS Gauge Round
Demonstrates a circular column gauge chart.
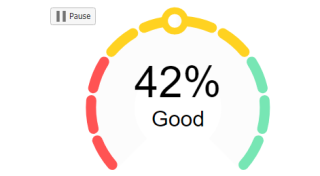
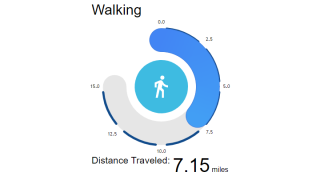
- JS Circular Live Data
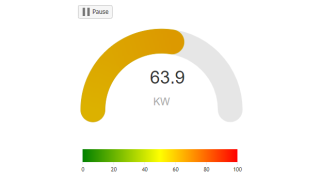
Demonstrates using a real-time circular gauge.
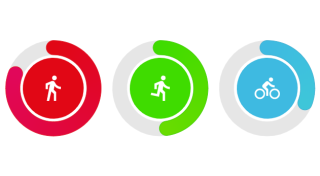
- JS Circular Activity
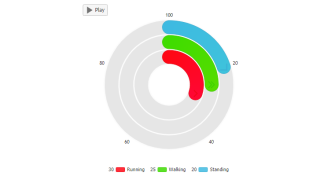
Demonstrates activity rings chart that updates in real-time.
- JS Circular Countdown
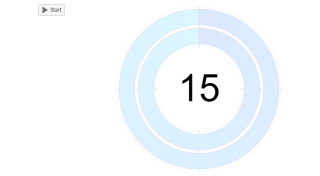
Demonstrates using circular column chart to simulate a countdown.
- JS Circular Gantt
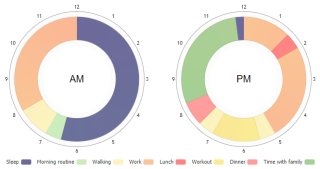
Demonstrates circular gauges with gantt data and a custom legend generated in JavaScript.
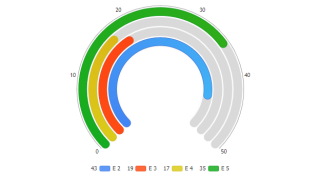
- JS Circular Line Breaks
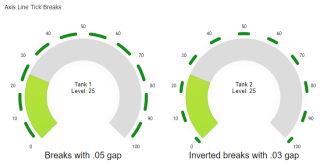
Demonstrates using axis line breaks at tick positions.
- JS Circular Nested
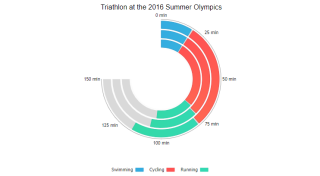
Demonstrates circular gauges with gantt data and a custom legend generated in JavaScript.
- JS Circular Overflow
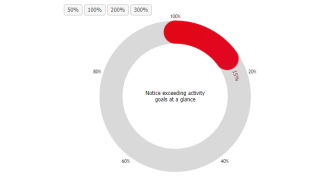
Demonstrates circular gauges with columns that exceed the y scale range.