Gallery
<%@ Page Language="C#" Description="dotnetCHARTING Component" %>
<%@ Register TagPrefix="dotnet" Namespace="dotnetCHARTING" Assembly="dotnetCHARTING"%>
<%@ Import Namespace="System.Drawing" %>
<script runat="server">
void Page_Load(Object sender,EventArgs e)
{
// Demonstrates hourglass shapes.
Chart.TempDirectory = "temp";
Chart.Debug = true;
Chart.LegendBox.Visible = false;
Chart.Type = ChartType.Combo;
Chart.Size = "600x350";
//Chart.Title = ".netCHARTING Sample";
Chart.DefaultSeries.Type = SeriesType.BubbleShape;
Chart.ShadingEffectMode = ShadingEffectMode.One;
Chart.DefaultElement.ShapeType = ShapeType.Hourglass;
Chart.XAxis.TimePadding = TimeSpan.FromDays(1);
Chart.YAxis.Label.Text = "Minutes Spent";
// *DYNAMIC DATA NOTE*
// This sample uses random data to populate the chart. To populate
// a chart with database data see the following resources:
// - Help File > Getting Started > Data Tutorials
// - DataEngine Class in the help file
// - Sample: features/DataEngine.aspx
SeriesCollection mySC = getRandomData();
// Add the random data.
Chart.SeriesCollection.Add(mySC);
}
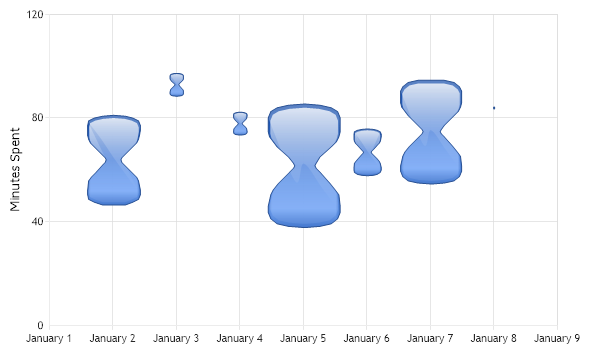
SeriesCollection getRandomData()
{
Random myR = new Random(3);
DateTime dt = new DateTime(2022,1,1);
SeriesCollection SC = new SeriesCollection();
for(int a = 1; a < 2; a++)
{
Series s = new Series("Series " + a.ToString());
for(int b = 1; b < 8; b++)
{
Element e = new Element("");
e.YValue = myR.Next(50)+50;
e.BubbleSize = myR.Next(50);
e.XDateTime = dt = dt.AddDays(1);
s.Elements.Add(e);
}
SC.Add(s);
}
return SC;
}
</script>
<html xmlns="http://www.w3.org/1999/xhtml">
<head><title>.netCHARTING Sample</title></head>
<body>
<div align="center">
<dotnet:Chart id="Chart" runat="server"/>
</div>
</body>
</html>
<%@ Page Language="vb" Description="dotnetCHARTING Component" %>
<%@ Register TagPrefix="dotnet" Namespace="dotnetCHARTING" Assembly="dotnetCHARTING"%>
<%@ Import Namespace="System.Drawing" %>
<script runat="server">
Sub Page_Load(ByVal sender As Object, ByVal e As EventArgs)
' Demonstrates hourglass shapes.
Chart.TempDirectory = "temp"
Chart.Debug = True
Chart.LegendBox.Visible = False
Chart.Type = ChartType.Combo
Chart.Size = "600x350"
'Chart.Title = ".netCHARTING Sample";
Chart.DefaultSeries.Type = SeriesType.BubbleShape
Chart.ShadingEffectMode = ShadingEffectMode.One
Chart.DefaultElement.ShapeType = ShapeType.Hourglass
Chart.XAxis.TimePadding = TimeSpan.FromDays(1)
Chart.YAxis.Label.Text = "Minutes Spent"
' *DYNAMIC DATA NOTE*
' This sample uses random data to populate the chart. To populate
' a chart with database data see the following resources:
' - Help File > Getting Started > Data Tutorials
' - DataEngine Class in the help file
' - Sample: features/DataEngine.aspx
Dim mySC As SeriesCollection = getRandomData()
' Add the random data.
Chart.SeriesCollection.Add(mySC)
End Sub
Function getRandomData() As SeriesCollection
Dim myR As Random = New Random(3)
Dim dt As DateTime = New DateTime(2022,1,1)
Dim SC As SeriesCollection = New SeriesCollection()
For a As Integer = 1 To 1
Dim s As Series = New Series("Series " & a.ToString())
For b As Integer = 1 To 7
Dim e As Element = New Element("")
e.YValue = myR.Next(50)+50
e.BubbleSize = myR.Next(50)
dt = dt.AddDays(1)
e.XDateTime = dt
s.Elements.Add(e)
Next b
SC.Add(s)
Next a
Return SC
End Function
</script>
<html xmlns="http://www.w3.org/1999/xhtml">
<head><title>.netCHARTING Sample</title></head>
<body>
<div align="center">
<dotnet:Chart id="Chart" runat="server"/>
</div>
</body>
</html>
- Sample FilenameGallery/L06.aspx
- Version4.2
- Uses DatabaseNo