// This sample will demonstrates how to use and attach axis markers to axes and elements.
// *DYNAMIC DATA NOTE* // This sample uses random data to populate the chart. To populate // a chart with database data see the following resources: // - Classic samples folder // - Help File > Data Tutorials // - Sample: features/DataEngine.aspx SeriesCollection mySC = getRandomData();
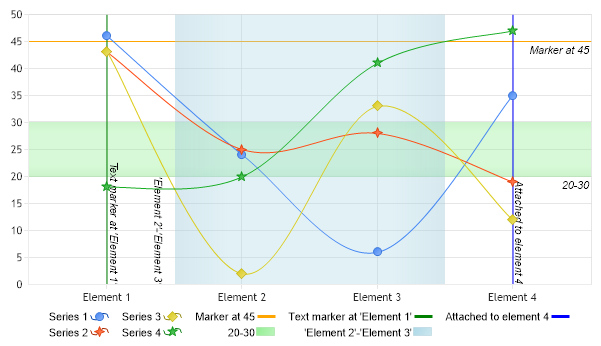
// 1. SINGLE VALUES AxisMarker am1 = new AxisMarker("Marker at 45",new Line(Color.Orange),45); Chart.YAxis.Markers.Add(am1);
AxisMarker am2 = new AxisMarker("Text marker at 'Element 1'",new Line(Color.Green),"Element 1"); Chart.XAxis.Markers.Add(am2);
// 2. RANGE MARKERS
AxisMarker am3 = new AxisMarker("20-30",new Background(Color.FromArgb(100,Color.LightGreen)),20,30); Chart.YAxis.Markers.Add(am3);
// 3.ELEMENT MARKERS mySC[0].Elements[3].AxisMarker = new AxisMarker("Attached to element 4",new Line(Color.Blue),0);
// Add the random data. Chart.SeriesCollection.Add(mySC);
}
SeriesCollection getRandomData() { SeriesCollection SC = new SeriesCollection(); Random myR = new Random(); for(int a = 1; a < 5; a++) { Series s = new Series(); s.Name = "Series " + a; for(int b = 1; b < 5; b++) { Element e = new Element(); e.Name = "Element " + b; e.YValue = myR.Next(50); s.Elements.Add(e); } SC.Add(s); }
' This sample will demonstrates how to use and attach axis markers to axes and elements.
' *DYNAMIC DATA NOTE* ' This sample uses random data to populate the chart. To populate ' a chart with database data see the following resources: ' - Classic samples folder ' - Help File > Data Tutorials ' - Sample: features/DataEngine.aspx Dim mySC As SeriesCollection = getRandomData()
' 1. SINGLE VALUES Dim am1 As AxisMarker = New AxisMarker("Marker at 45",New Line(Color.Orange),45) Chart.YAxis.Markers.Add(am1)
Dim am2 As AxisMarker = New AxisMarker("Text marker at 'Element 1'",New Line(Color.Green),"Element 1") Chart.XAxis.Markers.Add(am2)
' 2. RANGE MARKERS
Dim am3 As AxisMarker = New AxisMarker("20-30",New Background(Color.FromArgb(100,Color.LightGreen)),20,30) Chart.YAxis.Markers.Add(am3)
Dim am4 As AxisMarker = New AxisMarker("'Element 2'-'Element 3'",New Background(Color.FromArgb(100,Color.LightBlue)),"Element 2","Element 3") am4.Label.LineAlignment = StringAlignment.Near Chart.XAxis.Markers.Add(am4)
' 3.ELEMENT MARKERS mySC(0).Elements(3).AxisMarker = New AxisMarker("Attached to element 4",New Line(Color.Blue),0)
' Add the random data. Chart.SeriesCollection.Add(mySC)
End Sub
Function getRandomData() As SeriesCollection Dim SC As SeriesCollection = New SeriesCollection() Dim myR As Random = New Random() For a As Integer = 1 To 4 Dim s As Series = New Series() s.Name = "Series " & a For b As Integer = 1 To 4 Dim e As Element = New Element() e.Name = "Element " & b e.YValue = myR.Next(50) s.Elements.Add(e) Next b SC.Add(s) Next a
Return SC End Function </script> </head> <body> <div style="text-align:center"> <dotnet:Chart id="Chart" runat="server" Width="568px" Height="344px"> </dotnet:Chart> </div> </body> </html>