// Set the x axis label Chart.ChartArea.XAxis.Label.Text="X Axis Label";
// Set the y axis label Chart.ChartArea.YAxis.Label.Text="Y Axis Label"; Chart.TempDirectory="temp"; Chart.Debug=true; Chart.TitleBox.Position = TitleBoxPosition.FullWithLegend;
return myArrayList; } public class Product { string name; double total; public Product() { } public Product(string proName,double proTotal) { name = proName; total = proTotal; }
public string Name { get { return name; } set { name = value; } } public double Total { get { return total; } set { total = value; } }
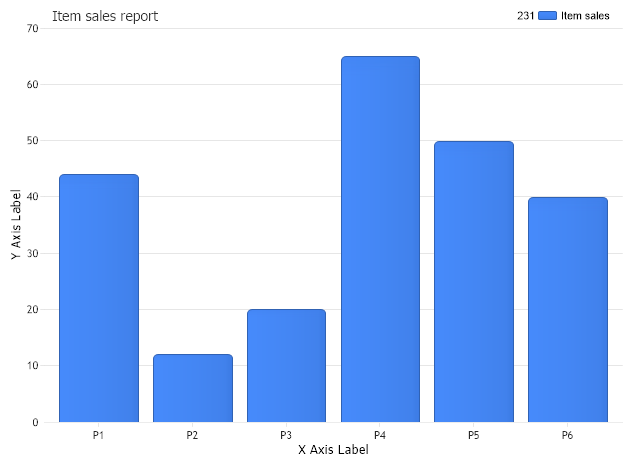
<script runat="server"> Sub Page_Load(ByVal sender As Object, ByVal e As EventArgs) 'set global properties Chart.Title="Item sales report"
' Set the x axis label Chart.ChartArea.XAxis.Label.Text="X Axis Label"
' Set the y axis label Chart.ChartArea.YAxis.Label.Text="Y Axis Label" Chart.TempDirectory="temp" Chart.Debug=True Chart.TitleBox.Position = TitleBoxPosition.FullWithLegend
End Sub Function CreateArrayList() As ArrayList Dim myArrayList As ArrayList = New ArrayList() myArrayList.Add(New Product("P1",44)) myArrayList.Add(New Product("P2",12)) myArrayList.Add(New Product("P3",20)) myArrayList.Add(New Product("P4",65)) myArrayList.Add(New Product("P5",50)) myArrayList.Add(New Product("P6",40))
Return myArrayList End Function Public Class Product Dim name_Renamed As String Dim total_Renamed As Double Public Sub New() End Sub Public Sub New(ByVal proName As String, ByVal proTotal As Double) name_Renamed = proName total_Renamed = proTotal End Sub
Public Property Name() As String Get Return name_Renamed End Get Set(ByVal value As String) name_Renamed = value End Set End Property Public Property Total() As Double Get Return total_Renamed End Get Set(ByVal value As Double) total_Renamed = value End Set End Property
End Class </script> <html xmlns="http://www.w3.org/1999/xhtml"><head><title>ArrayList Sample</title></head> <body> <div style="text-align:center"> <dotnet:Chart id="Chart" runat="server"/>