Gallery
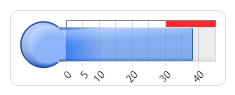
AMarkers HThermometer
<%@ Page Language="C#" Description="dotnetCHARTING Component" %>
<%@ Register TagPrefix="dotnet" Namespace="dotnetCHARTING" Assembly="dotnetCHARTING"%>
<%@ Import Namespace="System.Drawing" %>
<%@ Import Namespace="System.Drawing.Drawing2D" %>
<%@ Import Namespace="dotnetCHARTING.Mapping" %>
<script runat="server">
void Page_Load(Object sender,EventArgs e)
{
// Demonstrates a horizontal thermometer gauge with an axis marker.
Chart.TempDirectory = "temp";
Chart.Debug = true;
Chart.Type = ChartType.Gauges;
Chart.Size = "220x180";
//Chart.Title = ".netCHARTING Sample";
Chart.DefaultSeries.GaugeLinearStyle = GaugeLinearStyle.Thermometer;
Chart.ChartArea.Padding = 2;
Chart.Margin = "-3";
Chart.ChartArea.Background.Color = Color.Empty;
Chart.ChartArea.Shadow.Color = Color.Empty;
Chart.ChartArea.Line.Color = Color.Empty;
Chart.DefaultElement.Transparency = 40;
AxisMarker am = new AxisMarker("", Color.Red, 30,50);
Chart.YAxis.Markers.Add(am);
Chart.DefaultSeries.GaugeBorderBox.DefaultCorner = BoxCorner.Round;
Chart.DefaultSeries.GaugeBorderBox.Padding = 10;
Chart.DefaultSeries.GaugeBorderShape = GaugeBorderShape.UseBox;
Chart.YAxis.Orientation = dotnetCHARTING.Orientation.Left;
// *DYNAMIC DATA NOTE*
// This sample uses random data to populate the chart. To populate
// a chart with database data see the following resources:
// - Help File > Getting Started > Data Tutorials
// - DataEngine Class in the help file
// - Sample: features/DataEngine.aspx
SeriesCollection mySC = getRandomData();
//Chart.DefaultElement.ShowValue = true;
Chart.DefaultElement.SmartLabel.Alignment = LabelAlignment.Bottom;
Chart.DefaultElement.SmartLabel.Text = "%Name - (%YValue)";
Chart.DefaultSeries.GaugeType = GaugeType.Horizontal;
Chart.LegendBox.Visible = false;
// Add the random data.
Chart.SeriesCollection.Add(mySC);
}
SeriesCollection getRandomData()
{
Random myR = new Random();
SeriesCollection SC = new SeriesCollection();
for(int a = 1; a < 2; a++)
{
Series s = new Series("");
for(int b = 1; b < 2; b++)
{
Element e = new Element("Element " + b.ToString());
e.YValue = 38;// 25+myR.Next(25);
s.Elements.Add(e);
}
SC.Add(s);
}
return SC;
}
</script>
<html xmlns="http://www.w3.org/1999/xhtml">
<head><title>.netCHARTING Sample</title></head>
<body>
<div align="center">
<dotnet:Chart id="Chart" runat="server"/>
</div>
</body>
</html>
<%@ Page Language="vb" Description="dotnetCHARTING Component" %>
<%@ Register TagPrefix="dotnet" Namespace="dotnetCHARTING" Assembly="dotnetCHARTING"%>
<%@ Import Namespace="System.Drawing" %>
<%@ Import Namespace="System.Drawing.Drawing2D" %>
<%@ Import Namespace="dotnetCHARTING.Mapping" %>
<script runat="server">
Sub Page_Load(ByVal sender As Object, ByVal e As EventArgs)
' Demonstrates a horizontal thermometer gauge with an axis marker.
Chart.TempDirectory = "temp"
Chart.Debug = True
Chart.Type = ChartType.Gauges
Chart.Size = "220x180"
'Chart.Title = ".netCHARTING Sample";
Chart.DefaultSeries.GaugeLinearStyle = GaugeLinearStyle.Thermometer
Chart.ChartArea.Padding = 2
Chart.Margin = "-3"
Chart.ChartArea.Background.Color = Color.Empty
Chart.ChartArea.Shadow.Color = Color.Empty
Chart.ChartArea.Line.Color = Color.Empty
Chart.DefaultElement.Transparency = 40
Dim am As AxisMarker = New AxisMarker("", Color.Red, 30,50)
Chart.YAxis.Markers.Add(am)
Chart.DefaultSeries.GaugeBorderBox.DefaultCorner = BoxCorner.Round
Chart.DefaultSeries.GaugeBorderBox.Padding = 10
Chart.DefaultSeries.GaugeBorderShape = GaugeBorderShape.UseBox
Chart.YAxis.Orientation = dotnetCHARTING.Orientation.Left
' *DYNAMIC DATA NOTE*
' This sample uses random data to populate the chart. To populate
' a chart with database data see the following resources:
' - Help File > Getting Started > Data Tutorials
' - DataEngine Class in the help file
' - Sample: features/DataEngine.aspx
Dim mySC As SeriesCollection = getRandomData()
'Chart.DefaultElement.ShowValue = true;
Chart.DefaultElement.SmartLabel.Alignment = LabelAlignment.Bottom
Chart.DefaultElement.SmartLabel.Text = "%Name - (%YValue)"
Chart.DefaultSeries.GaugeType = GaugeType.Horizontal
Chart.LegendBox.Visible = False
' Add the random data.
Chart.SeriesCollection.Add(mySC)
End Sub
Function getRandomData() As SeriesCollection
Dim myR As Random = New Random()
Dim SC As SeriesCollection = New SeriesCollection()
For a As Integer = 1 To 1
Dim s As Series = New Series("")
For b As Integer = 1 To 1
Dim e As Element = New Element("Element " & b.ToString())
e.YValue = 38 ' 25+myR.Next(25);
s.Elements.Add(e)
Next b
SC.Add(s)
Next a
Return SC
End Function
</script>
<html xmlns="http://www.w3.org/1999/xhtml">
<head><title>.netCHARTING Sample</title></head>
<body>
<div align="center">
<dotnet:Chart id="Chart" runat="server"/>
</div>
</body>
</html>
- Sample FilenameGallery/h033.aspx
- Version4.3
- Uses DatabaseNo