Gallery
AMarkers HLinear Gauge
<%@ Page Language="C#" Description="dotnetCHARTING Component" %>
<%@ Register TagPrefix="dotnet" Namespace="dotnetCHARTING" Assembly="dotnetCHARTING" %>
<%@ Import Namespace="System.Drawing" %>
<%@ Import Namespace="System.Drawing.Drawing2D" %>
<%@ Import Namespace="dotnetCHARTING.Mapping" %>
<script runat="server">
void Page_Load(Object sender, EventArgs e)
{
// Demonstrates a horizontal linear gauge with an axis marker.
Chart.TempDirectory = "temp";
Chart.Debug = true;
Chart.Type = ChartType.Gauges;
Chart.Size = "260x150";
Chart.ChartArea.Padding = 2;
Chart.Margin = "-3";
Chart.DefaultSeries.GaugeType = GaugeType.Horizontal;
Chart.LegendBox.Visible = false;
Chart.YAxis.Orientation = dotnetCHARTING.Orientation.Left;
Chart.DefaultSeries.Background.Color = Color.FromArgb(20, Color.SkyBlue);
Chart.ChartArea.Background.Color = Color.Empty;
Chart.ChartArea.Shadow.Color = Color.Empty;
Chart.ChartArea.Line.Color = Color.Empty;
Chart.DefaultElement.Transparency = 40;
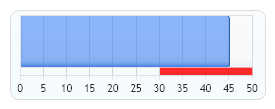
AxisMarker am = new AxisMarker("", Color.Red, 30, 50);
Chart.YAxis.Markers.Add(am);
Chart.DefaultSeries.GaugeBorderBox.DefaultCorner = BoxCorner.Round;
Chart.DefaultSeries.GaugeBorderBox.Padding = 5;
Chart.DefaultSeries.GaugeBorderShape = GaugeBorderShape.UseBox;
// *DYNAMIC DATA NOTE*
// This sample uses random data to populate the chart. To populate
// a chart with database data see the following resources:
// - Help File > Getting Started > Data Tutorials
// - DataEngine Class in the help file
// - Sample: features/DataEngine.aspx
SeriesCollection mySC = getRandomData();
Chart.DefaultElement.SmartLabel.Alignment = LabelAlignment.Bottom;
Chart.DefaultElement.SmartLabel.Text = "%Name - (%YValue)";
// Add the random data.
Chart.SeriesCollection.Add(mySC);
}
SeriesCollection getRandomData()
{
return new SeriesCollection(new Series("", new Element("Element 1", 45)));
}
</script>
<html xmlns="http://www.w3.org/1999/xhtml">
<head>
<title>.netCHARTING Sample</title>
</head>
<body>
<div align="center">
<dotnet:Chart ID="Chart" runat="server" />
</div>
</body>
</html>
<%@ Page Language="vb" Description="dotnetCHARTING Component" %>
<%@ Register TagPrefix="dotnet" Namespace="dotnetCHARTING" Assembly="dotnetCHARTING" %>
<%@ Import Namespace="System.Drawing" %>
<%@ Import Namespace="System.Drawing.Drawing2D" %>
<%@ Import Namespace="dotnetCHARTING.Mapping" %>
<script runat="server">
Sub Page_Load(ByVal sender As Object, ByVal e As EventArgs)
' Demonstrates a horizontal linear gauge with an axis marker.
Chart.TempDirectory = "temp"
Chart.Debug = True
Chart.Type = ChartType.Gauges
Chart.Size = "260x150"
Chart.ChartArea.Padding = 2
Chart.Margin = "-3"
Chart.DefaultSeries.GaugeType = GaugeType.Horizontal
Chart.LegendBox.Visible = False
Chart.YAxis.Orientation = dotnetCHARTING.Orientation.Left
Chart.DefaultSeries.Background.Color = Color.FromArgb(20, Color.SkyBlue)
Chart.ChartArea.Background.Color = Color.Empty
Chart.ChartArea.Shadow.Color = Color.Empty
Chart.ChartArea.Line.Color = Color.Empty
Chart.DefaultElement.Transparency = 40
Dim am As AxisMarker = New AxisMarker("", Color.Red, 30, 50)
Chart.YAxis.Markers.Add(am)
Chart.DefaultSeries.GaugeBorderBox.DefaultCorner = BoxCorner.Round
Chart.DefaultSeries.GaugeBorderBox.Padding = 5
Chart.DefaultSeries.GaugeBorderShape = GaugeBorderShape.UseBox
' *DYNAMIC DATA NOTE*
' This sample uses random data to populate the chart. To populate
' a chart with database data see the following resources:
' - Help File > Getting Started > Data Tutorials
' - DataEngine Class in the help file
' - Sample: features/DataEngine.aspx
Dim mySC As SeriesCollection = getRandomData()
Chart.DefaultElement.SmartLabel.Alignment = LabelAlignment.Bottom
Chart.DefaultElement.SmartLabel.Text = "%Name - (%YValue)"
' Add the random data.
Chart.SeriesCollection.Add(mySC)
End Sub
Function getRandomData() As SeriesCollection
Return New SeriesCollection(New Series("", New Element("Element 1", 45)))
End Function
</script>
<html xmlns="http://www.w3.org/1999/xhtml">
<head>
<title>.netCHARTING Sample</title>
</head>
<body>
<div align="center">
<dotnet:Chart ID="Chart" runat="server" />
</div>
</body>
</html>
- Sample FilenameGallery/h020.aspx
- Version4.3
- Uses DatabaseNo