void Page_Load(Object sender,EventArgs e) { // Set the title. //Chart.Title="My Chart";
// Set the directory where images are temporarily be stored. Chart.TempDirectory="temp";
// Disable the legend box Chart.LegendBox.Position = LegendBoxPosition.None;
// Set a default gauge face background color. Chart.DefaultSeries.Background.Color = Color.White;
// Set he chart size. Chart.Width = 600; Chart.Height = 350;
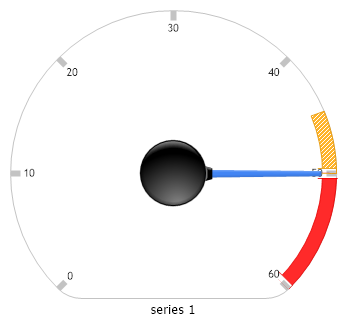
// Specify the gauges chart type Chart.Type = ChartType.Gauges;
// Create a series with a single element Series s1 = new Series("series 1",new Element("",50)); // Instantiate an axis for the created series. s1.YAxis = new Axis();
// Set visual properties of the axis. s1.YAxis.DefaultTick.Line.Width = 6; s1.YAxis.DefaultTick.Line.EndCap = LineCap.Triangle;
// Instantiate an axis marker. AxisMarker am = new AxisMarker("",new Background(Color.Red),50,60);
// Instantiate a background object for the second axis marker. Background b = new Background(Color.Orange); // Set hatch style properties of the axis marker. b.HatchStyle = HatchStyle.LightUpwardDiagonal; b.HatchColor = Color.White;
// Instantiate the second axis marker. AxisMarker am2 = new AxisMarker("",b,45,50);
// Add the two axis markers to the series' axis. s1.YAxis.Markers.Add(am); s1.YAxis.Markers.Add(am2);
Sub Page_Load(ByVal sender As Object, ByVal e As EventArgs) ' Set the title. 'Chart.Title="My Chart";
' Set the directory where images are temporarily be stored. Chart.TempDirectory="temp"
' Disable the legend box Chart.LegendBox.Position = LegendBoxPosition.None
' Set a default gauge face background color. Chart.DefaultSeries.Background.Color = Color.White
' Set he chart size. Chart.Width = 600 Chart.Height = 350
' Specify the gauges chart type Chart.Type = ChartType.Gauges
' Create a series with a single element Dim s1 As Series = New Series("series 1",New Element("",50)) ' Instantiate an axis for the created series. s1.YAxis = New Axis()
' Set visual properties of the axis. s1.YAxis.DefaultTick.Line.Width = 6 s1.YAxis.DefaultTick.Line.EndCap = LineCap.Triangle
' Instantiate an axis marker. Dim am As AxisMarker = New AxisMarker("",New Background(Color.Red),50,60)
' Instantiate a background object for the second axis marker. Dim b As Background = New Background(Color.Orange) ' Set hatch style properties of the axis marker. b.HatchStyle = HatchStyle.LightUpwardDiagonal b.HatchColor = Color.White
' Instantiate the second axis marker. Dim am2 As AxisMarker = New AxisMarker("",b,45,50)
' Add the two axis markers to the series' axis. s1.YAxis.Markers.Add(am) s1.YAxis.Markers.Add(am2)
' Add the series Chart.SeriesCollection.Add(s1)
End Sub </script> <html xmlns="http://www.w3.org/1999/xhtml"><head><title>Gallery Sample</title></head> <body> <div style="text-align:center"> <dotnet:Chart id="Chart" runat="server"/> </div> </body> </html>